## Diagram: Classification-based PRM vs. Generative PRM
### Overview
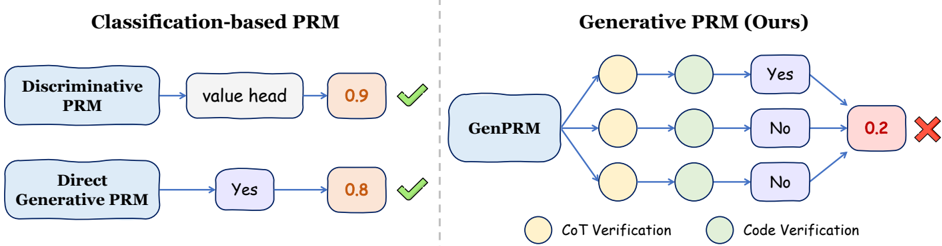
The image presents a comparison between two approaches to Probabilistic Reasoning Models (PRM): Classification-based PRM and Generative PRM. The diagram illustrates the flow and components of each approach, highlighting the differences in their verification processes and outcomes.
### Components/Axes
* **Title (Left):** Classification-based PRM
* **Title (Right):** Generative PRM (Ours)
* **Left Branch (Classification-based PRM):**
* Discriminative PRM (Blue Rounded Rectangle)
* value head (Light Blue Rounded Rectangle)
* 0.9 (Orange Rounded Rectangle)
* Green Checkmark
* **Bottom Branch (Classification-based PRM):**
* Direct Generative PRM (Blue Rounded Rectangle)
* Yes (Light Blue Rounded Rectangle)
* 0.8 (Orange Rounded Rectangle)
* Green Checkmark
* **Right Side (Generative PRM):**
* GenPRM (Blue Rounded Rectangle)
* Three parallel paths, each consisting of:
* CoT Verification (Yellow Circle)
* Code Verification (Light Green Circle)
* Yes/No (Light Blue Rounded Rectangle)
* 0.2 (Red Rounded Rectangle)
* Red X Mark
* **Legend (Bottom):**
* Yellow Circle: CoT Verification
* Light Green Circle: Code Verification
### Detailed Analysis
**Classification-based PRM (Left Side):**
* **Top Branch:** Starts with "Discriminative PRM" (blue), which flows into "value head" (light blue), resulting in a value of "0.9" (orange). This outcome is marked with a green checkmark, indicating success.
* **Bottom Branch:** Starts with "Direct Generative PRM" (blue), which flows into "Yes" (light blue), resulting in a value of "0.8" (orange). This outcome is also marked with a green checkmark, indicating success.
**Generative PRM (Right Side):**
* Starts with "GenPRM" (blue).
* Three parallel paths diverge from "GenPRM." Each path represents a different verification process.
* Each path consists of a "CoT Verification" (yellow circle) followed by a "Code Verification" (light green circle).
* The first path results in "Yes" (light blue).
* The second path results in "No" (light blue).
* The third path results in "No" (light blue).
* All three paths converge to a final value of "0.2" (red), which is marked with a red "X," indicating failure.
### Key Observations
* The Classification-based PRM approach yields higher values (0.9 and 0.8) and successful outcomes (green checkmarks).
* The Generative PRM approach results in a lower value (0.2) and a failed outcome (red "X").
* The Generative PRM uses a combination of "CoT Verification" and "Code Verification" in its process.
### Interpretation
The diagram suggests that the Classification-based PRM approach is more effective than the Generative PRM approach in this specific scenario. The higher values and successful outcomes associated with the Classification-based PRM indicate a better performance. The Generative PRM, despite using a combination of verification methods, results in a lower value and a failed outcome. The diagram highlights the differences in the methodologies and their respective results, implying that the "Ours" Generative PRM needs improvement. The values 0.9 and 0.8 on the left side, compared to 0.2 on the right, strongly suggest a performance disparity.