TECHNICAL ASSET FINGERPRINT
5dcc385bc298322ef8567c26
Click to view fullscreen
Press ESC or click to close
FOUND IN PAPERS
EXPERT: gemini-2.5-flash-free VERSION 1
RUNTIME: google-free/gemini-2.5-flash
INTEL_VERIFIED
## Diagram: Comparison of Classification-based PRM and Generative PRM (Ours)
### Overview
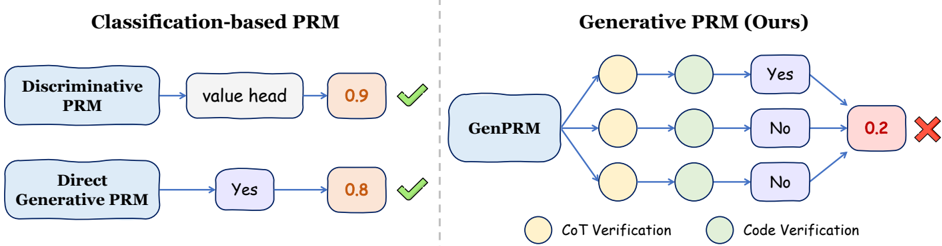
This image presents a technical diagram illustrating two distinct approaches to "PRM" (likely referring to a type of model or process): "Classification-based PRM" on the left and "Generative PRM (Ours)" on the right. The diagram uses flowcharts to depict the steps and outcomes of each approach, highlighting their differences in methodology and results, particularly in terms of final scores and success/failure indicators.
### Components/Axes
The image is divided vertically by a dashed grey line into two main sections, each with a distinct title at the top:
* **Left Section Title**: "Classification-based PRM"
* **Right Section Title**: "Generative PRM (Ours)"
**Legend (bottom-right of the image):**
* A yellow circle is labeled "CoT Verification"
* A green circle is labeled "Code Verification"
**Shapes and Colors Used:**
* **Blue Rounded Rectangles**: Represent initial model components or major stages (e.g., "Discriminative PRM", "Direct Generative PRM", "GenPRM").
* **Light Grey Rounded Rectangle**: Represents an intermediate output or component (e.g., "value head").
* **Light Purple Rounded Rectangles**: Represent intermediate or final binary decisions/outputs (e.g., "Yes", "No").
* **Orange Rounded Rectangles**: Represent final numerical scores or confidence values for successful outcomes (e.g., "0.9", "0.8").
* **Red Rounded Rectangle**: Represents a final numerical score or confidence value for an unsuccessful outcome (e.g., "0.2").
* **Yellow Circles**: Represent "CoT Verification" steps, as per the legend.
* **Green Circles**: Represent "Code Verification" steps, as per the legend.
* **Green Checkmark (✓)**: Indicates a successful outcome.
* **Red Cross (✗)**: Indicates an unsuccessful outcome.
* **Arrows**: Indicate the flow and direction of the process.
### Detailed Analysis
The diagram details two main systems:
**1. Classification-based PRM (Left Section):**
This section shows two distinct, parallel processes, both leading to successful outcomes.
* **Top Flow:**
* Starts with a blue rounded rectangle labeled "Discriminative PRM".
* An arrow points from "Discriminative PRM" to a light grey rounded rectangle labeled "value head".
* An arrow points from "value head" to an orange rounded rectangle containing the value "0.9".
* To the right of "0.9" is a green checkmark (✓), indicating success.
* **Bottom Flow:**
* Starts with a blue rounded rectangle labeled "Direct Generative PRM".
* An arrow points from "Direct Generative PRM" to a light purple rounded rectangle labeled "Yes".
* An arrow points from "Yes" to an orange rounded rectangle containing the value "0.8".
* To the right of "0.8" is a green checkmark (✓), indicating success.
**2. Generative PRM (Ours) (Right Section):**
This section depicts a single process that branches into multiple verification steps and ultimately leads to an unsuccessful outcome.
* **Initial Component:**
* Starts with a blue rounded rectangle labeled "GenPRM".
* **Branching Verification Paths:**
* From "GenPRM", three parallel arrows originate, leading to three identical sequences of verification steps.
* Each sequence consists of:
* A yellow circle, representing "CoT Verification" (as per the legend).
* An arrow pointing from the yellow circle to a green circle, representing "Code Verification" (as per the legend).
* An arrow pointing from the green circle to a light purple rounded rectangle, which represents a binary decision.
* The top path's decision is "Yes".
* The middle path's decision is "No".
* The bottom path's decision is "No".
* **Convergence and Final Outcome:**
* Arrows from all three decision nodes ("Yes", "No", "No") converge into a single point, which then leads to a red rounded rectangle containing the value "0.2".
* To the right of "0.2" is a red cross (✗), indicating failure or an undesirable outcome.
### Key Observations
* The "Classification-based PRM" methods (Discriminative PRM and Direct Generative PRM) both yield high confidence scores (0.9 and 0.8, respectively) and are marked as successful.
* The "Generative PRM (Ours)" method, despite employing a multi-step verification process involving "CoT Verification" and "Code Verification" for three parallel paths, results in a low aggregated score (0.2) and is marked as unsuccessful.
* In the "Generative PRM (Ours)" model, two out of the three verification paths result in a "No" decision, while only one results in "Yes". This imbalance likely contributes to the low final score of 0.2.
* The "Classification-based PRM" models appear to be simpler, more direct processes compared to the multi-branching, multi-stage verification process of the "Generative PRM (Ours)".
* The output format differs: "Classification-based PRM" directly outputs a score (0.9, 0.8) or a binary decision that leads to a score, while "Generative PRM (Ours)" aggregates multiple binary decisions ("Yes"/"No") into a final score.
### Interpretation
This diagram serves to contrast the performance or operational characteristics of existing "Classification-based PRM" models with a proposed "Generative PRM (Ours)" model. The visual representation strongly suggests that, in the context illustrated, the classification-based methods are more effective or yield more desirable results (higher scores, success indicators) than the generative method.
The "Generative PRM (Ours)" model, while seemingly more sophisticated with its "CoT Verification" (Chain of Thought Verification) and "Code Verification" steps, is depicted as failing to achieve a high score, possibly indicating a challenge in aggregating diverse verification outcomes or an inherent limitation in its current form. The low score of 0.2, coupled with the red cross, implies that the "Generative PRM (Ours)" model, as presented in this specific scenario, did not meet the desired performance criteria. The fact that two out of three verification paths resulted in "No" decisions for the generative model further reinforces this interpretation, suggesting that the majority of its internal verification steps did not confirm a positive outcome, leading to the low aggregated score.
The diagram could be used to:
1. Highlight a problem or a current limitation of the "Generative PRM (Ours)" model that the authors are trying to address.
2. Illustrate a specific failure case where the generative approach struggles compared to established classification methods.
3. Set the stage for further discussion on how to improve the "Generative PRM (Ours)" model to achieve better results, perhaps by refining the verification steps or the aggregation mechanism.
Ultimately, the diagram visually communicates that while classification-based PRM models are shown to be successful with high confidence, the generative PRM model, despite its complex verification process, currently yields a low confidence score and is deemed unsuccessful in this comparison.
DECODING INTELLIGENCE...