\n
## Diagram: Program Reasoning Model Comparison
### Overview
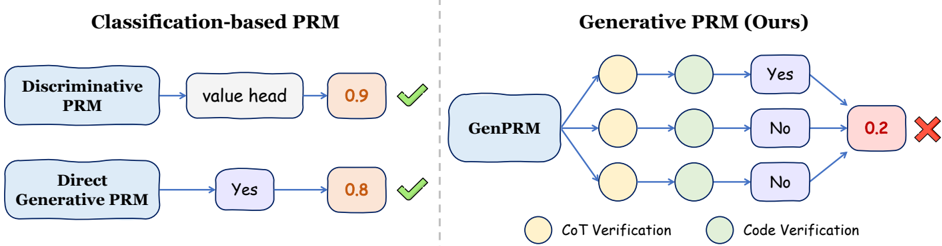
The image presents a diagram comparing two approaches to Program Reasoning Models (PRM): a Classification-based PRM and a Generative PRM (labeled as "Ours"). The diagram illustrates the flow of information and the associated confidence scores for each approach. The Generative PRM appears to involve a multi-step verification process.
### Components/Axes
The diagram is divided into two main sections separated by a dashed vertical line.
* **Left Side:** Classification-based PRM, containing two sub-components: "Discriminative PRM" and "Direct Generative PRM".
* **Right Side:** Generative PRM (labeled "GenPRM"), which includes a central "GenPRM" block and a series of interconnected verification steps.
* **Legend:** Located at the bottom-right, the legend defines the shapes and colors used to represent verification steps:
* Light Green Circle: "CoT Verification" (Chain of Thought)
* Light Blue Circle: "Code Verification"
* **Confidence Scores:** Orange rectangles display confidence scores associated with each process.
* **Yes/No Indicators:** Blue rectangles indicate the outcome of verification steps ("Yes" or "No").
* **Red X:** Indicates a failure in the Generative PRM process.
* **Green Checkmark:** Indicates a success in the Classification-based PRM process.
### Detailed Analysis or Content Details
**Classification-based PRM:**
* **Discriminative PRM:** Flows to a "value head" which outputs a confidence score of approximately 0.9. This is indicated by an orange rectangle with the value "0.9" and a green checkmark.
* **Direct Generative PRM:** Flows to a "Yes" indicator, which then flows to an orange rectangle with a confidence score of approximately 0.8. This is also indicated by a green checkmark.
**Generative PRM (Ours):**
* The "GenPRM" block (light blue rectangle) has three outgoing arrows.
* **Path 1:** Flows through three light green "CoT Verification" circles, then to a "Yes" indicator.
* **Path 2:** Flows through three light green "CoT Verification" circles, then to a "No" indicator.
* **Path 3:** Flows through three light blue "Code Verification" circles, then to a "No" indicator.
* The "No" indicators from Paths 2 and 3 converge to a final output with a confidence score of approximately 0.2, indicated by an orange rectangle with the value "0.2" and a red X.
### Key Observations
* The Classification-based PRM consistently achieves higher confidence scores (0.8-0.9) and is always successful (indicated by green checkmarks).
* The Generative PRM has a more complex flow with multiple verification steps.
* The Generative PRM ultimately results in a low confidence score (0.2) and a failure (indicated by the red X), suggesting that the verification process identified issues.
* The Generative PRM's failure is triggered by "No" outcomes from both CoT and Code Verification paths.
### Interpretation
The diagram demonstrates a comparison between two PRM approaches. The Classification-based PRM appears to be more reliable, consistently producing high confidence scores and successful outcomes. The Generative PRM, while potentially more sophisticated due to its multi-step verification process, is shown to be less reliable in this instance, resulting in a low confidence score and a failure. The diagram suggests that the Generative PRM's verification steps are effectively identifying flaws in its reasoning or code generation. The confidence scores provide a quantitative measure of the reliability of each approach. The diagram highlights the challenges of building robust generative models for program reasoning and the importance of effective verification mechanisms. The "Ours" label suggests that the Generative PRM is a novel approach being proposed by the authors of the document. The diagram is a visual representation of an experimental result, showcasing the performance of the two PRM approaches.