## Diagram: Comparison of Classification-based PRM vs. Generative PRM (Ours)
### Overview
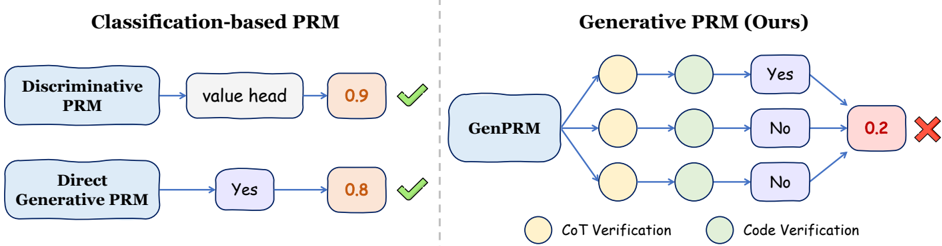
The diagram contrasts two approaches to Program Repair Mechanism (PRM): a **Classification-based PRM** (left) and a **Generative PRM (Ours)** (right). It uses probabilistic outcomes (e.g., 0.9, 0.8, 0.2) and verification steps (CoT, Code) to illustrate decision flows and success rates.
---
### Components/Axes
1. **Left Section (Classification-based PRM)**:
- **Discriminative PRM** → **value head** (0.9, ✅).
- **Direct Generative PRM** → **Yes** (0.8, ✅).
- Arrows indicate sequential decision paths.
2. **Right Section (Generative PRM)**:
- **GenPRM** branches into three paths:
- **CoT Verification** (yellow) → **Yes** → 0.2 (❌).
- **Code Verification** (green) → **No** → 0.2 (❌).
- Mixed paths (CoT + Code) → **No** → 0.2 (❌).
- Legend at bottom-right distinguishes **CoT Verification** (yellow) and **Code Verification** (green).
---
### Detailed Analysis
- **Classification-based PRM**:
- **Discriminative PRM** achieves a high success rate (0.9) via a "value head" component.
- **Direct Generative PRM** has a slightly lower success rate (0.8) but still succeeds (✅).
- **Generative PRM (Ours)**:
- All paths from **GenPRM** lead to **No** outcomes, resulting in a low success rate (0.2, ❌).
- **CoT Verification** (yellow) and **Code Verification** (green) are used as intermediate steps but fail to improve outcomes.
---
### Key Observations
1. **Success Rates**:
- Classification-based PRM outperforms Generative PRM (0.9/0.8 vs. 0.2).
- Generative PRM’s success rate is significantly lower despite additional verification steps.
2. **Verification Steps**:
- CoT and Code Verification in Generative PRM do not mitigate failure (all paths end in ❌).
3. **Flow Direction**:
- Left section: Linear paths with clear success.
- Right section: Branching paths with uniform failure.
---
### Interpretation
- **Effectiveness of Approaches**:
- The Classification-based PRM demonstrates higher reliability, suggesting that discriminative methods (e.g., value head) are more robust for this task.
- The Generative PRM’s lower success rate (0.2) implies that generative models, even with verification steps, struggle to match the performance of classification-based systems in this context.
- **Verification Limitations**:
- The failure of CoT and Code Verification in Generative PRM highlights potential weaknesses in post-hoc validation steps when applied to generative models.
- **Design Implications**:
- The diagram suggests that hybrid approaches (combining discriminative and generative methods) might need architectural adjustments to improve outcomes. The stark contrast in success rates underscores the need for further optimization in generative PRM pipelines.