## Bar Chart: Task 08ed6ac7
### Overview
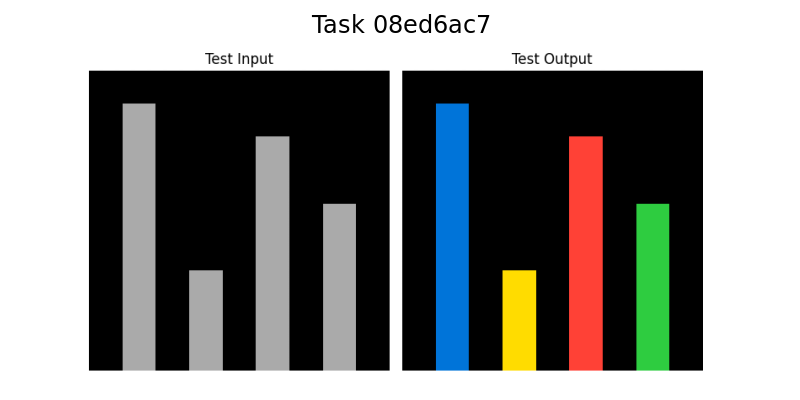
The image presents two bar charts side-by-side, labeled "Test Input" and "Test Output." The "Test Input" chart displays three gray bars of varying heights against a black background. The "Test Output" chart displays four colored bars (blue, yellow, red, and green) of varying heights against a black background. The image is titled "Task 08ed6ac7".
### Components/Axes
* **Title:** Task 08ed6ac7
* **Left Chart Title:** Test Input
* **Right Chart Title:** Test Output
* **Left Chart Bars:** Three gray bars of different heights.
* **Right Chart Bars:** Four bars colored blue, yellow, red, and green, of different heights.
* **Background:** Black for both charts.
* **X-axis:** Implicit categorical axis, with no labels.
* **Y-axis:** Implicit numerical axis, with no labels or scale.
### Detailed Analysis
**Test Input (Left Chart):**
* **Bar 1 (Gray):** Height is approximately 80% of the chart height.
* **Bar 2 (Gray):** Height is approximately 30% of the chart height.
* **Bar 3 (Gray):** Height is approximately 60% of the chart height.
**Test Output (Right Chart):**
* **Bar 1 (Blue):** Height is approximately 90% of the chart height.
* **Bar 2 (Yellow):** Height is approximately 25% of the chart height.
* **Bar 3 (Red):** Height is approximately 70% of the chart height.
* **Bar 4 (Green):** Height is approximately 50% of the chart height.
### Key Observations
* The "Test Input" chart has three bars, while the "Test Output" chart has four.
* The heights of the bars vary significantly in both charts.
* The "Test Input" chart uses only gray bars, while the "Test Output" chart uses blue, yellow, red, and green bars.
### Interpretation
The image likely represents a comparison between an input state and an output state, where the bars represent some quantifiable feature or value. The change in the number of bars and their respective heights, as well as the change in color, suggests a transformation or processing step has occurred between the input and output. Without further context, the specific meaning of the bars and their colors is unknown. The task ID "08ed6ac7" may refer to a specific experiment or process.