## Line Graph: AUC Performance vs. Number of Training Bags
### Overview
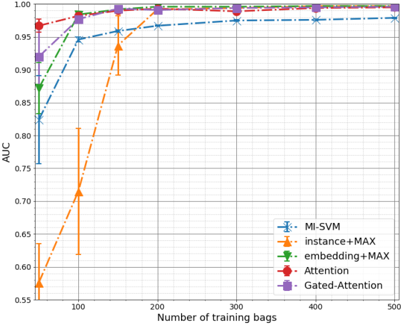
The image is a line graph comparing the performance of five machine learning methods (AUC metric) across varying numbers of training bags (0–500). The graph includes error bars for uncertainty visualization and a legend for method identification. All lines converge toward higher AUC values as training data increases, with distinct early-stage performance differences.
### Components/Axes
- **X-axis**: "Number of training bags" (0–500, increments of 100)
- **Y-axis**: "AUC" (0.55–1.00, increments of 0.05)
- **Legend**: Located in the bottom-right corner, mapping colors/styles to methods:
- Blue dashed line with stars: MI-SVM
- Orange dashed line with triangles: instance+MAX
- Green dotted line with squares: embedding+MAX
- Red dotted line with circles: Attention
- Purple solid line with diamonds: Gated-Attention
- **Error Bars**: Vertical lines at each data point, varying in length (e.g., MI-SVM at 100 bags: ±0.02; Gated-Attention at 100 bags: ±0.03).
### Detailed Analysis
1. **MI-SVM** (Blue):
- Starts at ~0.85 AUC at 100 bags, rising steeply to ~0.98 by 200 bags.
- Error bars: ±0.02 at 100 bags, ±0.01 at 200+ bags.
- Plateaus near 0.99 after 300 bags.
2. **instance+MAX** (Orange):
- Begins at ~0.55 AUC at 100 bags, surging to ~0.95 by 200 bags.
- Error bars: ±0.03 at 100 bags, ±0.01 at 200+ bags.
- Reaches ~0.99 by 500 bags.
3. **embedding+MAX** (Green):
- Starts at ~0.90 AUC at 100 bags, rising to ~0.99 by 200 bags.
- Error bars: ±0.015 at 100 bags, ±0.01 at 200+ bags.
- Maintains ~0.99 AUC after 300 bags.
4. **Attention** (Red):
- Begins at ~0.95 AUC at 100 bags, peaking at ~0.99 by 200 bags.
- Error bars: ±0.01 at all stages.
- Stable performance after 200 bags.
5. **Gated-Attention** (Purple):
- Starts at ~0.88 AUC at 100 bags, rising to ~0.99 by 200 bags.
- Error bars: ±0.03 at 100 bags, ±0.01 at 200+ bags.
- Matches embedding+MAX performance after 300 bags.
### Key Observations
- **Early-Stage Variance**: instance+MAX and Gated-Attention show the largest initial AUC gaps (~0.55 vs. ~0.95 at 100 bags).
- **Convergence**: All methods plateau near 0.99 AUC after 200–300 bags, suggesting diminishing returns with more data.
- **Error Bar Trends**: Methods with steeper early gains (e.g., instance+MAX) have larger initial uncertainty, while stable performers (Attention) have smaller error bars.
- **Line Crossings**: Gated-Attention overtakes embedding+MAX between 100–200 bags, while instance+MAX closes the gap with MI-SVM by 200 bags.
### Interpretation
The graph demonstrates that:
1. **Data Efficiency**: Methods like Attention and embedding+MAX achieve high AUC with fewer training bags, indicating better data efficiency.
2. **Scalability**: instance+MAX and Gated-Attention require more data to reach peak performance but catch up to top performers by 200–300 bags.
3. **Uncertainty Trade-offs**: Methods with larger error bars (e.g., Gated-Attention at 100 bags) may reflect higher variance in training outcomes or model instability.
4. **Practical Implications**: For resource-constrained scenarios, embedding+MAX or Attention might be preferable. For large datasets, instance+MAX and Gated-Attention offer competitive performance with potential advantages in specific contexts (e.g., handling imbalanced data).
The convergence of lines suggests that while initial method choice impacts early performance, most approaches achieve similar efficacy with sufficient training data. Error bars highlight the importance of considering uncertainty when comparing methods with similar AUC values.