# Technical Document Extraction: Attention Key Query Score Chart
## Chart Title
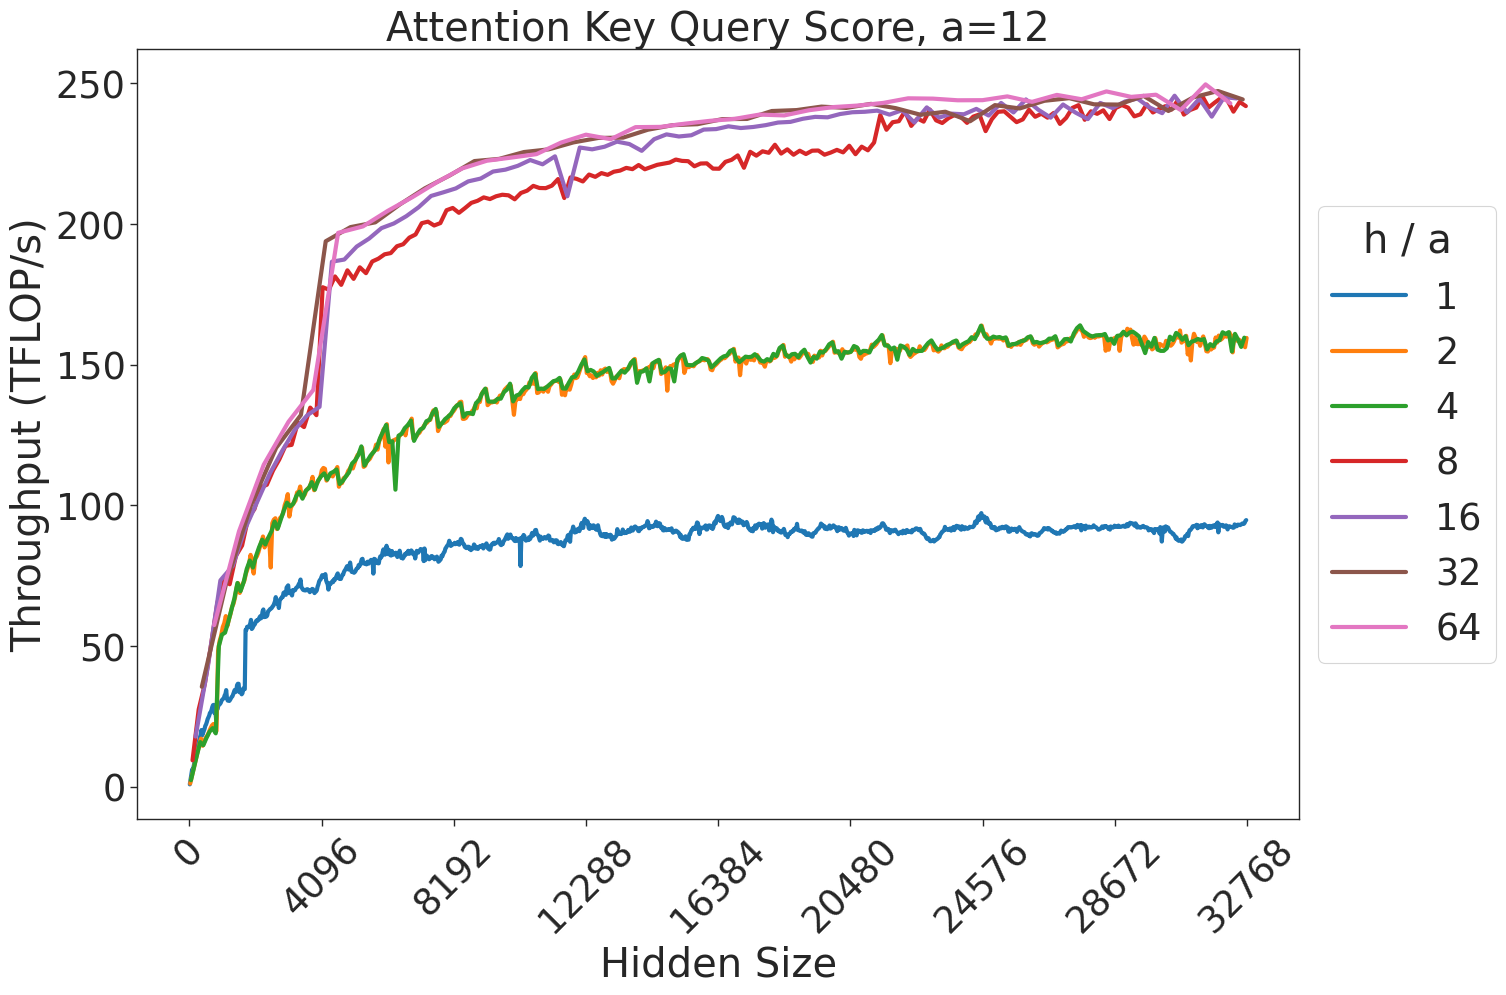
**Attention Key Query Score, a=12**
## Axes Labels
- **X-axis**: Hidden Size (ranges from 0 to 32768)
- **Y-axis**: Throughput (TFLOPs/s) (ranges from 0 to 250)
## Legend
- **Location**: Right side of the chart
- **Color-Coded Labels**:
- Blue: h/a = 1
- Orange: h/a = 2
- Green: h/a = 4
- Red: h/a = 8
- Purple: h/a = 16
- Brown: h/a = 32
- Pink: h/a = 64
## Key Trends and Data Points
### Line Analysis
1. **Blue (h/a=1)**
- **Trend**: Gradual upward slope, plateauing near 100 TFLOPs/s.
- **Key Points**:
- At hidden size 4096: ~70 TFLOPs/s
- At hidden size 8192: ~90 TFLOPs/s
- At hidden size 32768: ~95 TFLOPs/s
2. **Orange (h/a=2)**
- **Trend**: Slightly steeper than blue, plateauing near 150 TFLOPs/s.
- **Key Points**:
- At hidden size 4096: ~100 TFLOPs/s
- At hidden size 8192: ~130 TFLOPs/s
- At hidden size 32768: ~150 TFLOPs/s
3. **Green (h/a=4)**
- **Trend**: Moderate slope, plateauing near 160 TFLOPs/s.
- **Key Points**:
- At hidden size 4096: ~120 TFLOPs/s
- At hidden size 8192: ~140 TFLOPs/s
- At hidden size 32768: ~160 TFLOPs/s
4. **Red (h/a=8)**
- **Trend**: Steeper ascent, plateauing near 220 TFLOPs/s.
- **Key Points**:
- At hidden size 4096: ~180 TFLOPs/s
- At hidden size 8192: ~210 TFLOPs/s
- At hidden size 32768: ~230 TFLOPs/s
5. **Purple (h/a=16)**
- **Trend**: Sharp rise, plateauing near 240 TFLOPs/s.
- **Key Points**:
- At hidden size 4096: ~200 TFLOPs/s
- At hidden size 8192: ~230 TFLOPs/s
- At hidden size 32768: ~240 TFLOPs/s
6. **Brown (h/a=32)**
- **Trend**: Near-maximal performance, plateauing near 245 TFLOPs/s.
- **Key Points**:
- At hidden size 4096: ~220 TFLOPs/s
- At hidden size 8192: ~240 TFLOPs/s
- At hidden size 32768: ~245 TFLOPs/s
7. **Pink (h/a=64)**
- **Trend**: Highest performance, plateauing near 250 TFLOPs/s.
- **Key Points**:
- At hidden size 4096: ~230 TFLOPs/s
- At hidden size 8192: ~245 TFLOPs/s
- At hidden size 32768: ~250 TFLOPs/s
## Spatial Grounding
- **Legend Placement**: Right-aligned, adjacent to the chart.
- **Color Consistency**:
- Blue line matches h/a=1 (legend).
- Pink line matches h/a=64 (legend).
- All other colors align with their respective h/a values.
## Component Isolation
1. **Header**: Chart title centered at the top.
2. **Main Chart**:
- Lines plotted against hidden size (x-axis) and throughput (y-axis).
- Lines converge at higher hidden sizes, indicating diminishing returns.
3. **Footer**: No additional text or components.
## Language and Transcription
- **Primary Language**: English.
- **No Other Languages Detected**.
## Summary
The chart illustrates the relationship between hidden size and throughput (TFLOPs/s) for varying h/a ratios (1, 2, 4, 8, 16, 32, 64). Higher h/a ratios achieve greater throughput but exhibit diminishing returns as hidden size increases. The pink line (h/a=64) achieves the highest throughput (~250 TFLOPs/s), while the blue line (h/a=1) performs the lowest (~95 TFLOPs/s). All lines plateau near their maximum throughput at hidden size 32768.