## Line Graph: Score vs. Mean Score Over Generations
### Overview
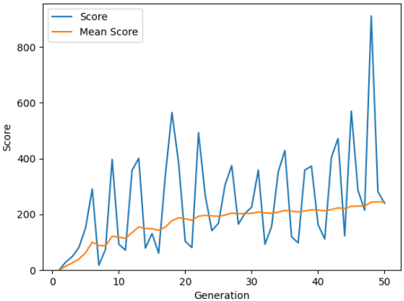
The image depicts a line graph comparing two metrics across 50 generations: "Score" (blue line) and "Mean Score" (orange line). The y-axis represents scores ranging from 0 to 800, while the x-axis represents generations from 0 to 50. The blue line exhibits significant volatility, with sharp peaks and troughs, whereas the orange line shows a smoother, gradual upward trend.
### Components/Axes
- **X-axis (Horizontal)**: Labeled "Generation," with markers at intervals of 10 (0, 10, 20, ..., 50).
- **Y-axis (Vertical)**: Labeled "Score," with markers at intervals of 200 (0, 200, 400, 600, 800).
- **Legend**: Located in the top-left corner, associating:
- **Blue line**: "Score"
- **Orange line**: "Mean Score"
### Detailed Analysis
1. **Score (Blue Line)**:
- **Trend**: Highly volatile, with sharp peaks and deep troughs.
- **Key Data Points**:
- Starts near 0 at generation 0.
- First peak at ~300 (generation 5).
- Second peak at ~550 (generation 15).
- Third peak at ~500 (generation 25).
- Final peak at ~850 (generation 50), exceeding the y-axis maximum of 800.
- **Uncertainty**: Peaks are approximate due to jagged line; exact values cannot be determined without gridlines.
2. **Mean Score (Orange Line)**:
- **Trend**: Smooth, gradual increase with minimal fluctuations.
- **Key Data Points**:
- Starts near 0 at generation 0.
- Rises steadily to ~250 by generation 50.
- **Uncertainty**: Values are interpolated between markers; exact values require finer resolution.
### Key Observations
- The "Score" line shows extreme variability, with peaks exceeding the "Mean Score" by 2–3x at certain generations (e.g., generation 50).
- The "Mean Score" line acts as a stabilizing force, averaging out the volatility of individual "Scores."
- The final spike in "Score" at generation 50 is an outlier, suggesting a sudden anomaly or breakthrough.
### Interpretation
The graph likely represents iterative performance metrics in a generative process (e.g., machine learning, evolutionary algorithms). The "Score" reflects individual trial outcomes, while the "Mean Score" captures the overall trend. The final spike in "Score" could indicate a critical breakthrough or outlier event in the final generation, warranting further investigation. The divergence between the two lines highlights the tension between individual variability and systemic trends.