# Technical Data Extraction: Failure Analysis Breakdown
This document provides a comprehensive extraction of data from the provided infographic, which illustrates the distribution and sub-categorization of system failures.
## 1. Overview (Main Chart)
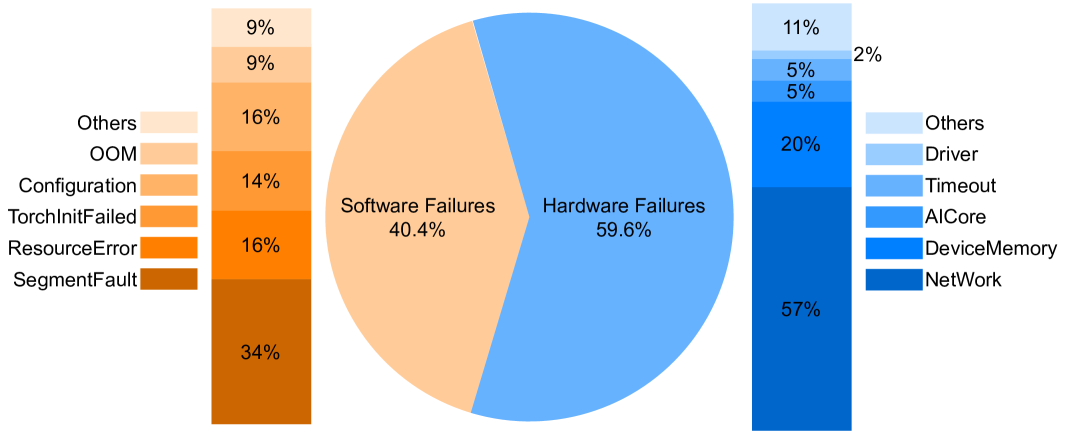
The central component is a pie chart dividing total failures into two primary categories.
| Category | Percentage | Color Code |
| :--- | :--- | :--- |
| **Hardware Failures** | 59.6% | Blue |
| **Software Failures** | 40.4% | Orange/Peach |
---
## 2. Software Failures Breakdown (Left Segment)
The software failures (40.4% of total) are further decomposed into six sub-categories via a stacked bar chart and a corresponding legend.
### Legend and Spatial Grounding
The legend is located on the far left. The bar chart is positioned between the legend and the central pie chart. The color gradient transitions from dark orange (bottom) to light peach (top).
### Data Table: Software Sub-categories
| Sub-category | Percentage (of Software Failures) | Color Description |
| :--- | :--- | :--- |
| **SegmentFault** | 34% | Dark Brownish-Orange |
| **ResourceError** | 16% | Deep Orange |
| **TorchInitFailed** | 14% | Vibrant Orange |
| **Configuration** | 16% | Medium Orange |
| **OOM** (Out of Memory) | 9% | Light Orange |
| **Others** | 9% | Pale Peach |
**Trend Analysis:** "SegmentFault" is the dominant software failure mode, accounting for over one-third of software issues. "ResourceError," "TorchInitFailed," and "Configuration" represent a middle tier of frequency (14-16% each), while "OOM" and "Others" are the least frequent.
---
## 3. Hardware Failures Breakdown (Right Segment)
The hardware failures (59.6% of total) are decomposed into six sub-categories via a stacked bar chart and a corresponding legend.
### Legend and Spatial Grounding
The legend is located on the far right. The bar chart is positioned between the central pie chart and the legend. The color gradient transitions from dark blue (bottom) to very light blue (top).
### Data Table: Hardware Sub-categories
| Sub-category | Percentage (of Hardware Failures) | Color Description |
| :--- | :--- | :--- |
| **NetWork** | 57% | Dark Navy Blue |
| **DeviceMemory** | 20% | Bright Blue |
| **AICore** | 5% | Medium Blue |
| **Timeout** | 5% | Sky Blue |
| **Driver** | 2% | Light Blue |
| **Others** | 11% | Pale Blue |
**Trend Analysis:** The hardware failure distribution is highly skewed. "NetWork" issues constitute the vast majority (57%) of hardware-related failures. "DeviceMemory" is the second most significant factor at 20%. All other specific categories (AICore, Timeout, Driver) are relatively minor, though the "Others" category is notable at 11%.
---
## 4. Summary of Findings
* **Primary Driver:** Hardware failures are the more frequent cause of system issues (59.6%).
* **Critical Hardware Point:** Network issues are the single largest specific failure point across the entire dataset (57% of the 59.6% hardware share).
* **Critical Software Point:** SegmentFault is the leading software issue (34% of the 40.4% software share).
* **Terminology Note:**
* **OOM:** Likely refers to "Out of Memory."
* **TorchInitFailed:** Likely refers to initialization failures in the PyTorch machine learning framework.
* **AICore:** Refers to failures in specialized AI processing units.