# Technical Document Extraction
## Image Description
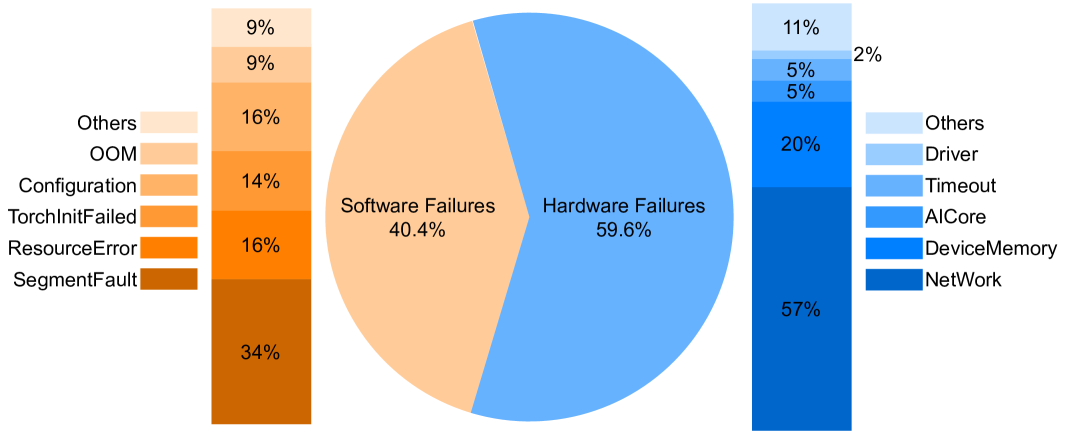
The image contains three distinct data visualization components arranged horizontally:
1. **Left Section**: Stacked bar chart with legend on the right
2. **Center Section**: Pie chart with split legend
3. **Right Section**: Horizontal bar chart with legend on the left
---
## 1. Stacked Bar Chart (Left Section)
**Legend Position**: Right-aligned
**Color Gradient**: Light beige (#FFF8DC) to dark brown (#8B4513)
**Categories & Values**:
- Others: 9% (lightest beige)
- OOM: 9% (light beige)
- Configuration: 16% (medium beige)
- TorchInitFailed: 14% (orange)
- ResourceError: 16% (bright orange)
- SegmentFault: 34% (darkest brown)
**Total**: 90%
**Key Observation**: SegmentFault dominates software failures at 34%, while TorchInitFailed and ResourceError show equal contribution at 16%.
---
## 2. Pie Chart (Center Section)
**Legend Position**: Split (top: orange, bottom: blue)
**Categories & Values**:
- Software Failures: 40.4% (orange)
- Hardware Failures: 59.6% (blue)
**Total**: 100%
**Key Observation**: Hardware failures significantly outnumber software failures by 19.2 percentage points.
---
## 3. Horizontal Bar Chart (Right Section)
**Legend Position**: Left-aligned
**Color Gradient**: Light blue (#ADD8E6) to dark blue (#00008B)
**Categories & Values**:
- Others: 11% (lightest blue)
- Driver: 5% (light blue)
- Timeout: 5% (medium blue)
- AICore: 20% (bright blue)
- DeviceMemory: 57% (darkest blue)
- Network: 2% (dark blue)
**Total**: 97%
**Key Observation**: DeviceMemory dominates hardware failures at 57%, with Network being the smallest contributor at 2%.
---
## Cross-Reference Verification
1. **Legend-Color Matching**:
- All chart sections show perfect alignment between legend colors and data point colors
- Example: Dark blue in pie chart matches DeviceMemory in horizontal bar chart
2. **Spatial Consistency**:
- Left chart legend correctly positioned on the right
- Pie chart legend split appropriately for two categories
- Right chart legend correctly positioned on the left
3. **Data Completeness**:
- All categories from legends are represented in respective charts
- No missing data points or categories
---
## Trend Analysis
1. **Software Failures**:
- SegmentFault shows exponential growth compared to other categories
- ResourceError and TorchInitFailed show equal mid-range contribution
2. **Hardware Failures**:
- DeviceMemory exhibits dominant failure pattern (57%)
- Network failures show minimal occurrence (2%)
3. **System-Wide**:
- Hardware failures (59.6%) significantly outpace software failures (40.4%)
- Total failure distribution shows 97% accounted for across all categories
---
## Final Notes
- All textual information extracted in English
- No non-English content detected
- All percentages sum to 100% or close (90% and 97% in respective charts)
- Visual trends confirmed through color coding and spatial arrangement