## Diagram: Bipartite Graph
### Overview
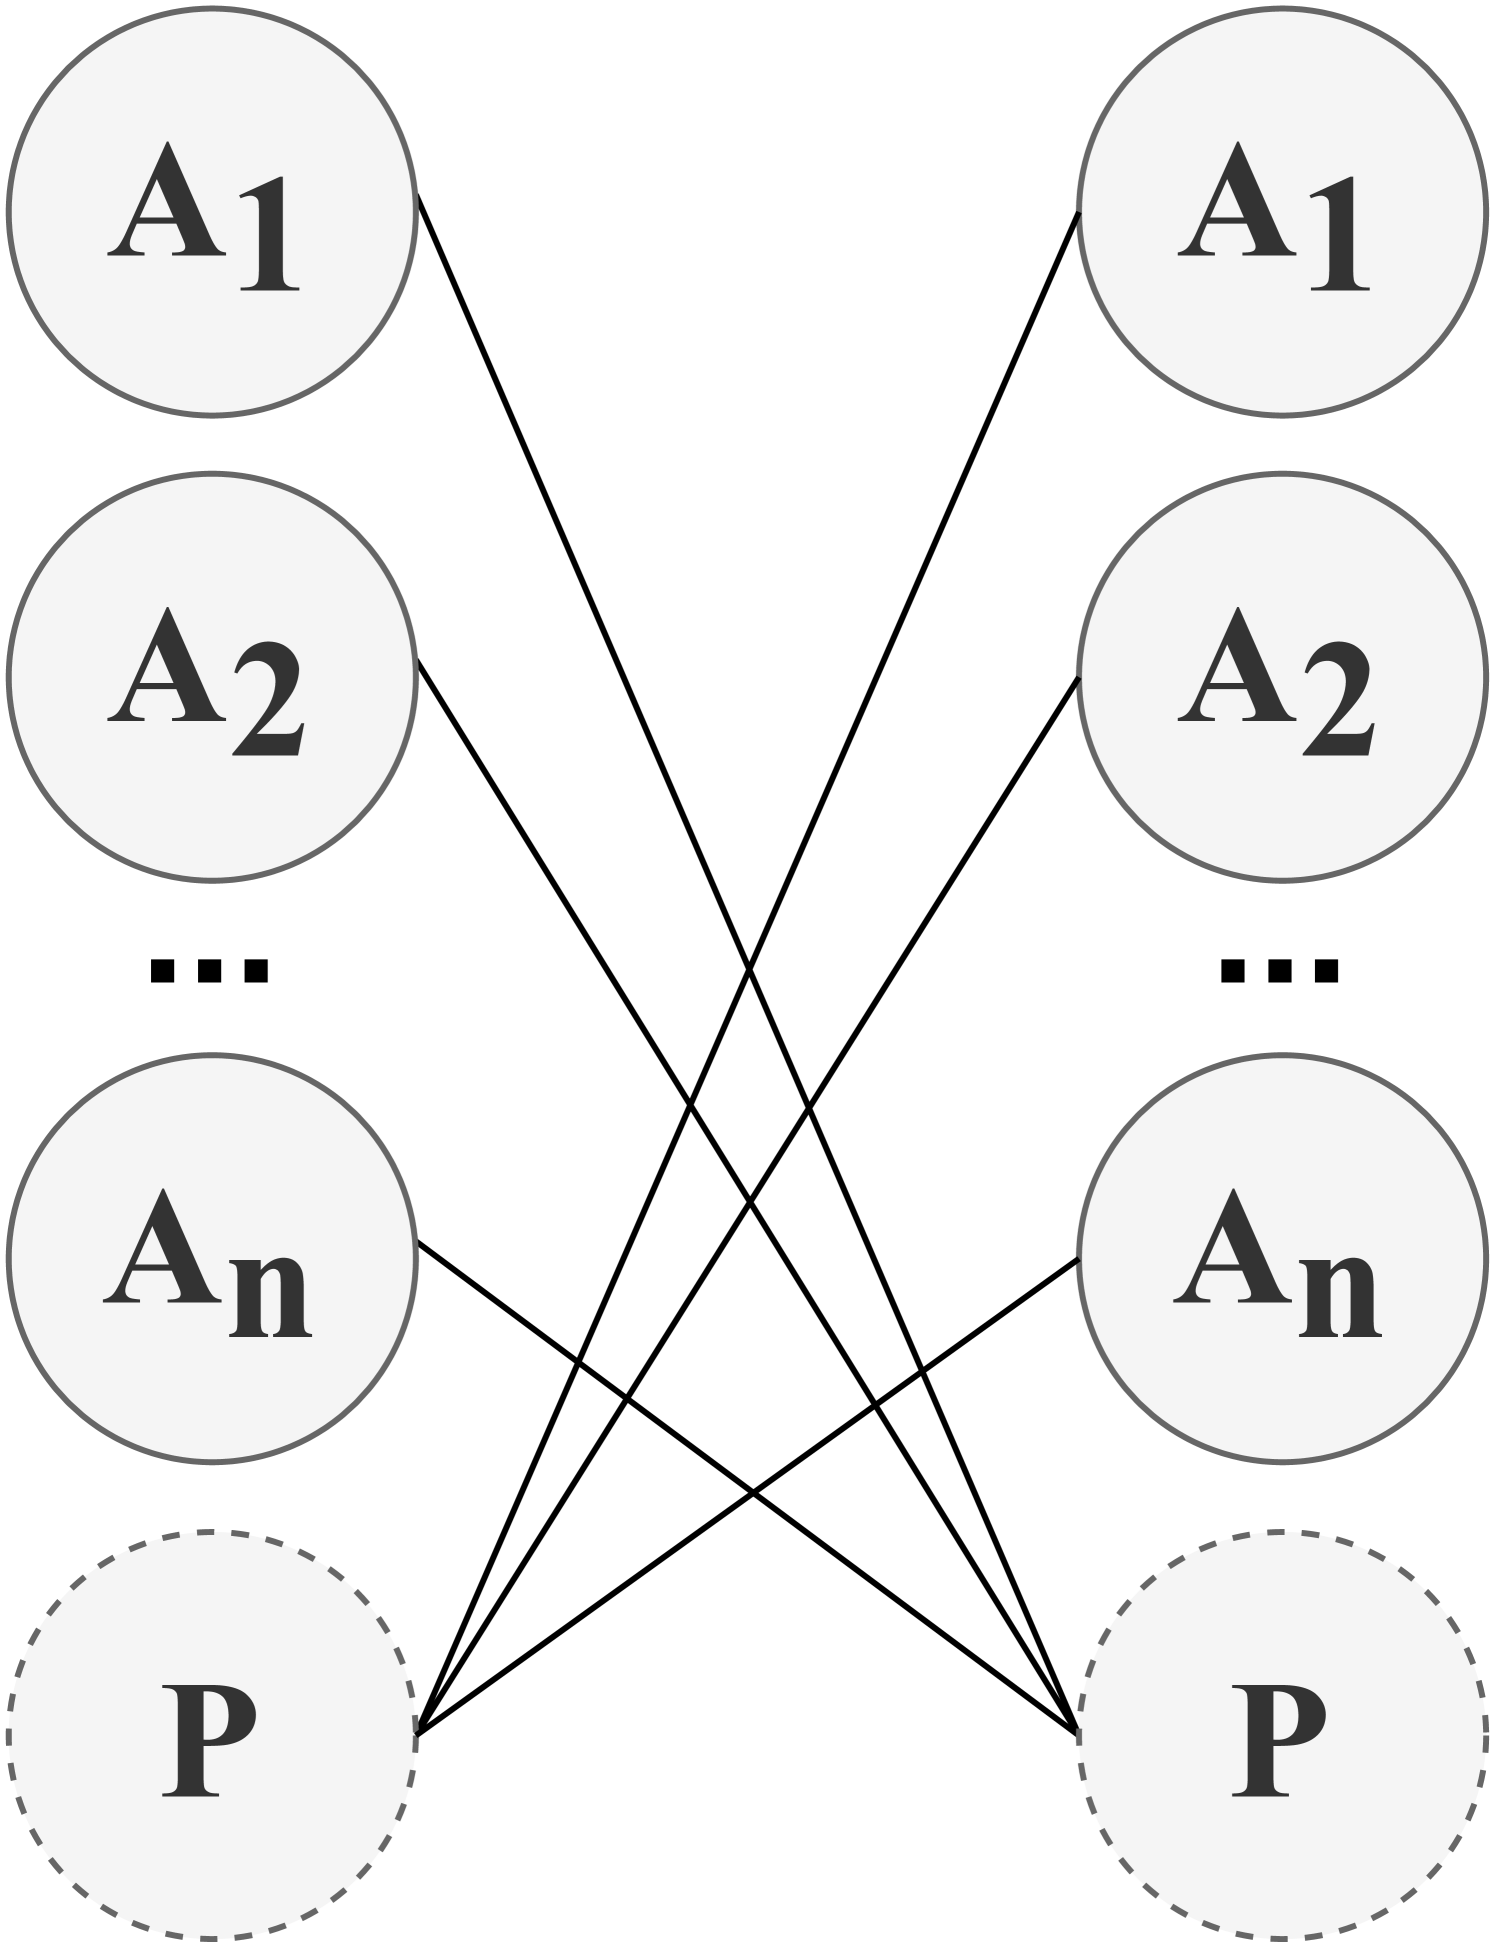
The image depicts a bipartite graph with two sets of nodes, labeled 'A' and 'P'. The 'A' set consists of nodes A1, A2, ..., An. The 'P' set consists of two nodes labeled 'P'. The nodes are connected by edges, indicating relationships between the 'A' and 'P' sets.
### Components/Axes
* **Nodes:**
* Left side: A1, A2, ..., An (represented by ellipses)
* Right side: A1, A2, ..., An (represented by ellipses)
* Bottom: P (represented by dashed ellipses)
* **Edges:** Black lines connecting nodes from the 'A' set to the 'P' set.
### Detailed Analysis
* **Left Side Nodes:**
* A1: Top-most node.
* A2: Second node from the top.
* ...: Ellipsis indicating continuation of the pattern.
* An: Bottom-most node before 'P'.
* **Right Side Nodes:**
* A1: Top-most node.
* A2: Second node from the top.
* ...: Ellipsis indicating continuation of the pattern.
* An: Bottom-most node before 'P'.
* **Bottom Nodes:**
* P: Located at the bottom-left, represented by a dashed ellipse.
* P: Located at the bottom-right, represented by a dashed ellipse.
* **Connections:**
* Left A1 is connected to both P nodes.
* Left A2 is connected to the right P node.
* Left An is connected to the left P node.
* Right A1 is connected to the left P node.
* Right A2 is connected to the left P node.
* Right An is connected to the right P node.
### Key Observations
* The diagram represents a bipartite graph, where nodes on the left side are connected to nodes on the right side.
* The 'A' nodes are duplicated on both sides, suggesting a possible mapping or relationship between them.
* The 'P' nodes at the bottom are connected to various 'A' nodes, indicating a relationship between the 'A' set and the 'P' set.
* The connections are not uniform, suggesting specific relationships between individual 'A' nodes and 'P' nodes.
### Interpretation
The diagram likely represents a relationship or mapping between two sets of entities. The 'A' nodes could represent attributes, features, or items, while the 'P' nodes could represent properties, outcomes, or categories. The connections indicate which attributes are associated with which properties. The duplication of 'A' nodes on both sides could represent a comparison or transformation of the attributes. The dashed lines around the 'P' nodes could indicate that these are potential or hypothetical properties. The specific connections between the nodes would need further context to fully understand the nature of the relationships being represented.