\n
## Diagram: Conceptual Relationship Illustration
### Overview
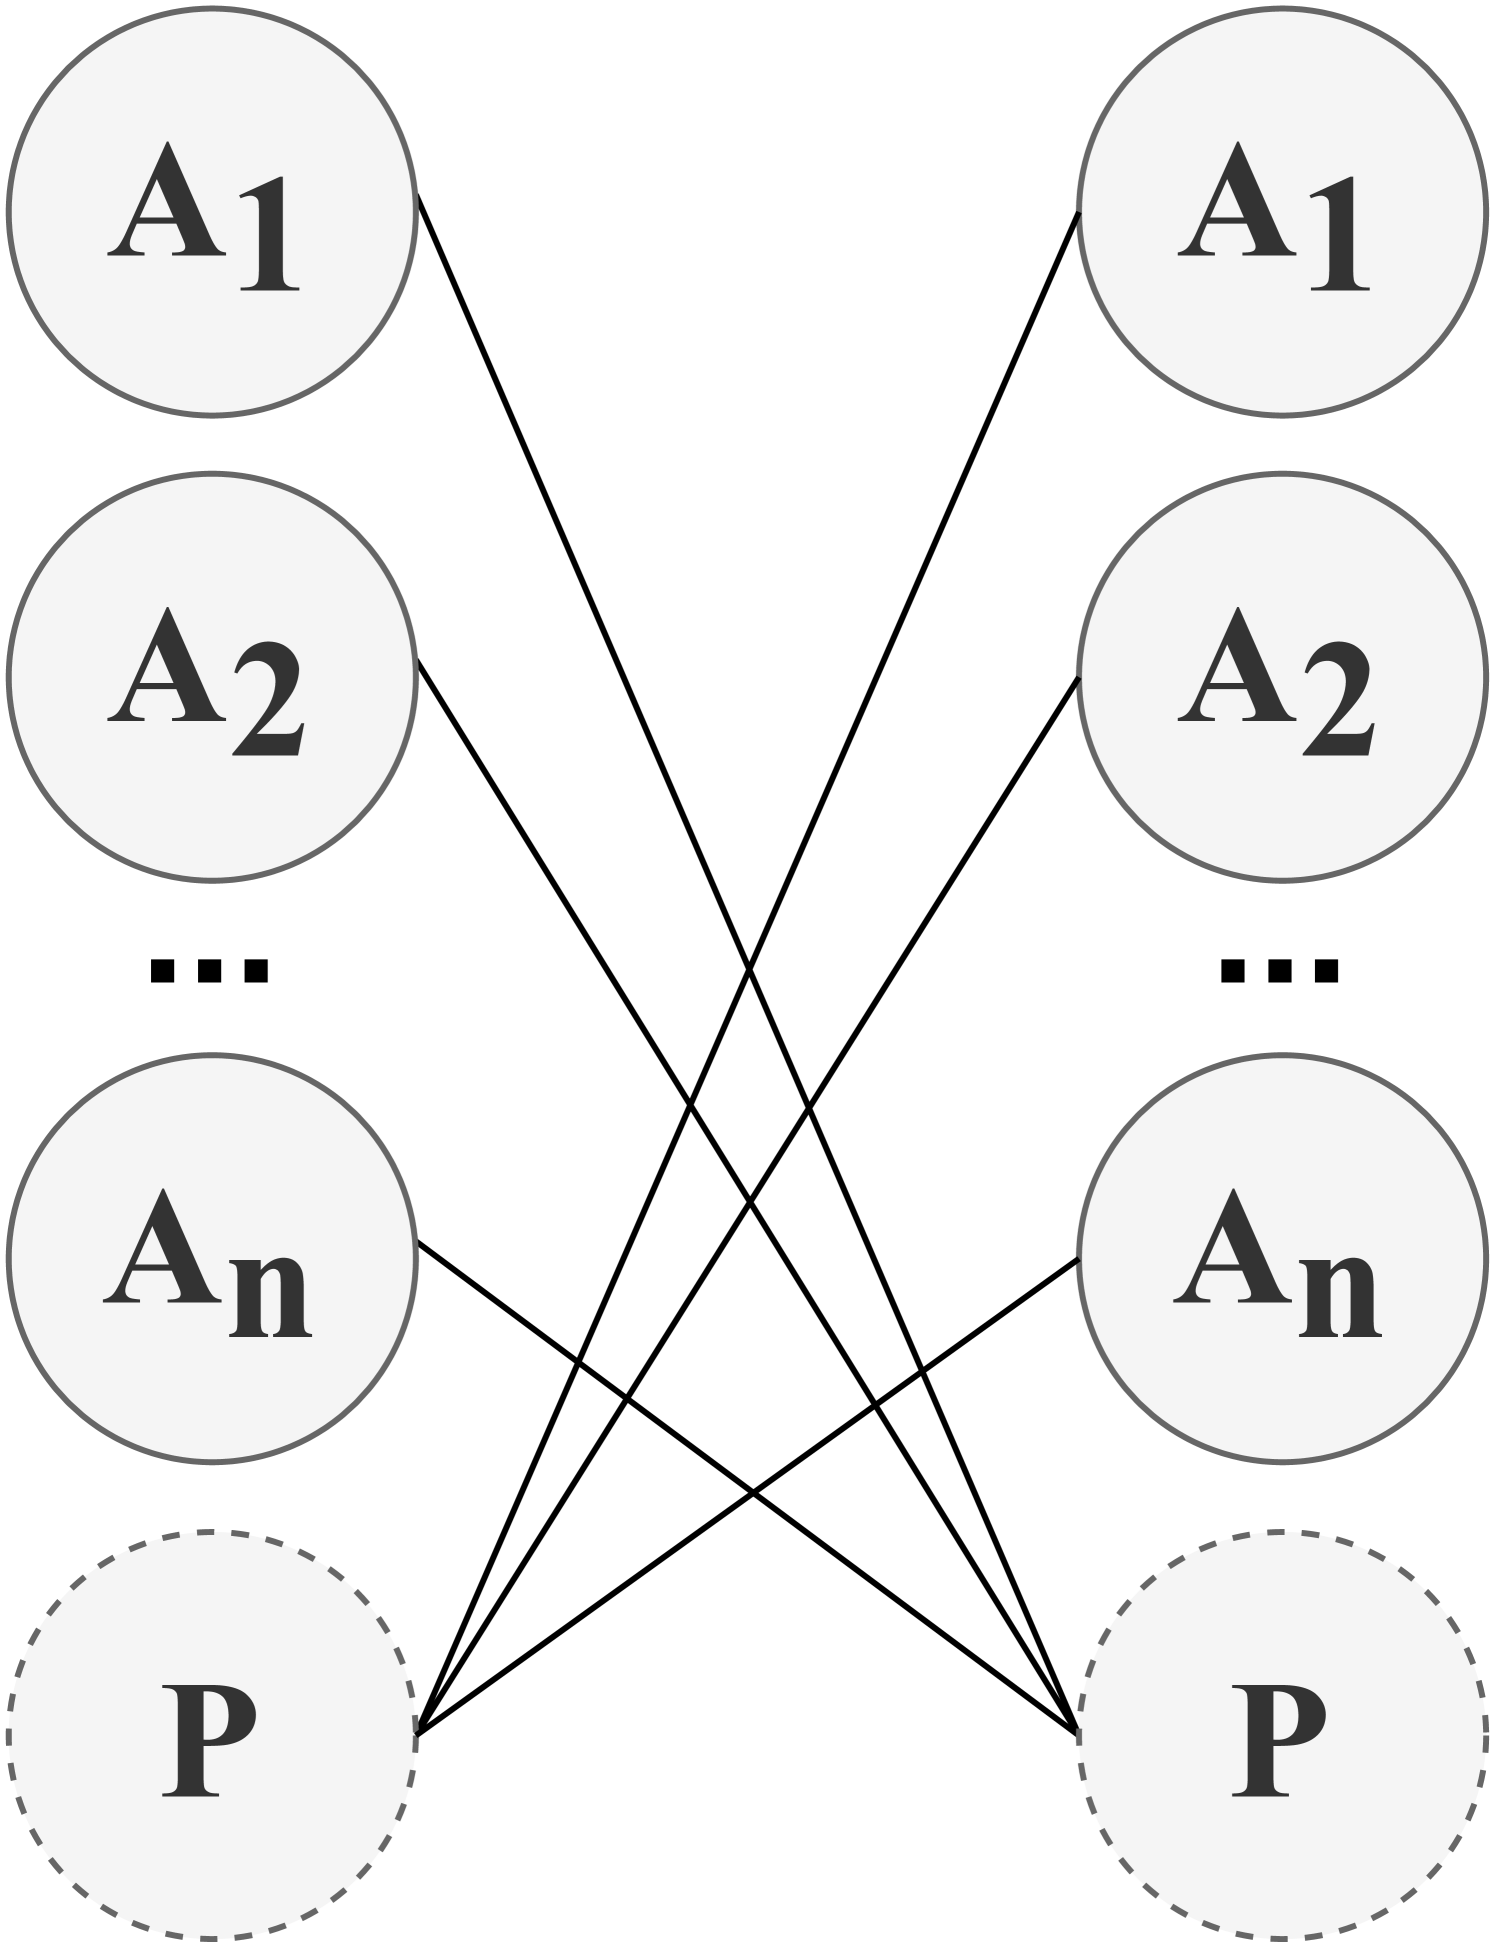
The image depicts a diagram illustrating a relationship between two sets of elements: A1 through An, and P. The diagram uses circles to represent these elements and lines to indicate connections between them. The diagram appears to represent a many-to-many relationship.
### Components/Axes
The diagram consists of the following components:
* **Left Side:** A vertical series of circles labeled A1, A2, and An (with ellipses indicating continuation).
* **Right Side:** A mirrored vertical series of circles labeled A1, A2, and An (with ellipses indicating continuation).
* **Bottom:** Two circles labeled "P", each enclosed within a dashed circle.
* **Lines:** Straight lines connecting each element A1, A2, and An on the left side to each element P on the bottom, and each element A1, A2, and An on the right side to each element P on the bottom.
### Detailed Analysis or Content Details
The diagram shows a connection between the elements A1, A2, ..., An and the elements P. Each element Ai (where i ranges from 1 to n) is connected to both P circles.
* **A1:** Connected to both P circles.
* **A2:** Connected to both P circles.
* **An:** Connected to both P circles.
* **P:** Each P circle is connected to all elements A1, A2, ..., An on both the left and right sides.
The diagram does not contain any numerical data or scales. It is a purely conceptual representation.
### Key Observations
The diagram highlights a many-to-many relationship. Each element from the set {A1, A2, ..., An} is associated with both elements P. The duplication of the A1-An elements on both sides suggests a potential distinction or parallel processing of these elements. The dashed circles around the P elements might indicate a special status or grouping.
### Interpretation
The diagram likely represents a mapping or association between two sets of entities. The 'A' elements could represent inputs, features, or options, while the 'P' elements could represent processes, outputs, or results. The many-to-many relationship suggests that each input can contribute to multiple processes/outputs, and each process/output can be influenced by multiple inputs.
The duplication of the A elements on either side of the diagram could indicate a parallel or mirrored operation. For example, it could represent two different processing paths for the same set of inputs. The dashed circles around the P elements might signify that these are critical or shared resources.
Without further context, the precise meaning of the diagram remains open to interpretation. However, it clearly illustrates a complex relationship where multiple elements from one set are connected to multiple elements from another set. It is a visual representation of a set of associations, rather than a quantitative measurement.