## Line Chart: Pile Test Loss vs. Context Length
### Overview
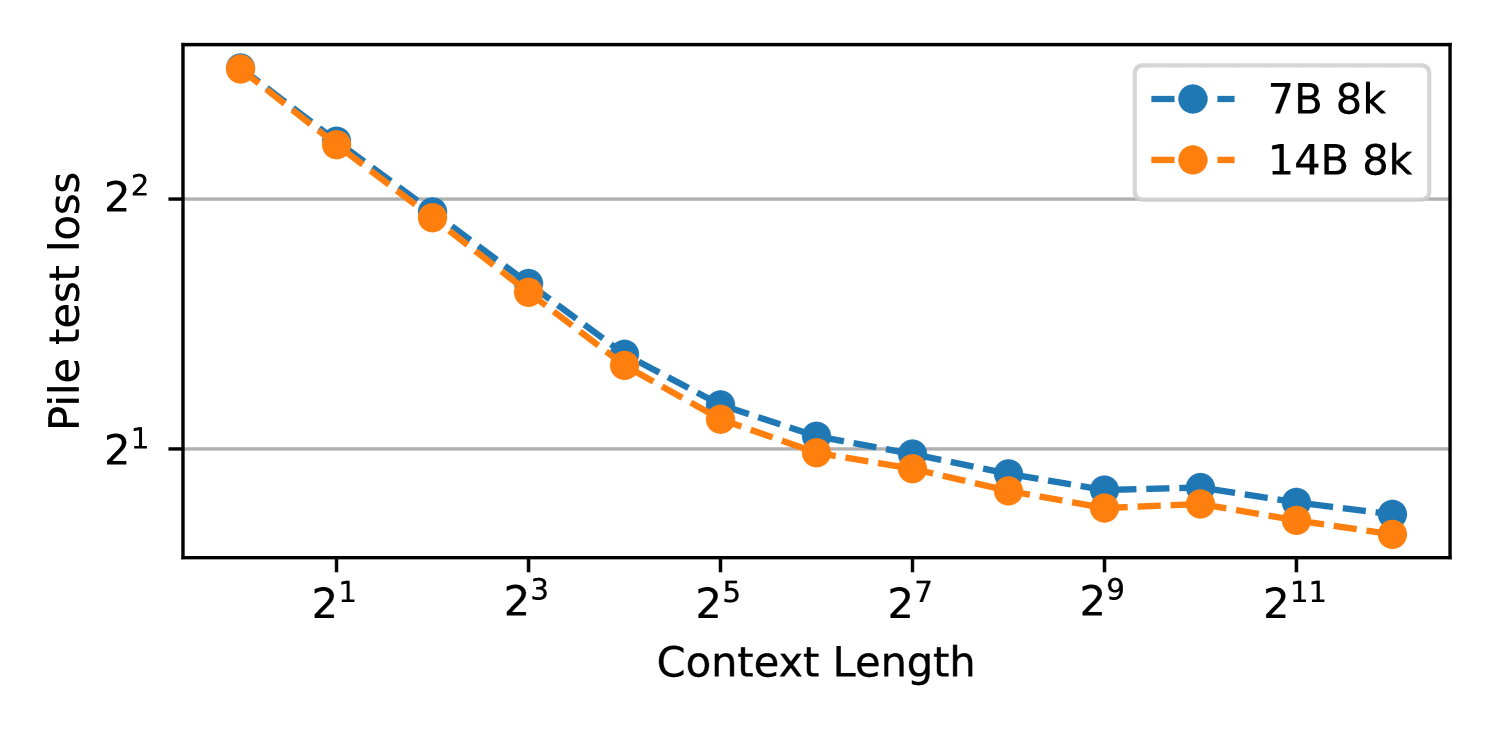
The image depicts a logarithmic line chart comparing pile test loss across different context lengths for two model configurations: 7B 8k (blue dashed line) and 14B 8k (orange dashed line). Both axes use logarithmic scales, with context length ranging from 2¹ to 2¹¹ and pile test loss from 2¹ to 2².
### Components/Axes
- **X-axis (Context Length)**: Logarithmic scale from 2¹ to 2¹¹, labeled "Context Length."
- **Y-axis (Pile Test Loss)**: Logarithmic scale from 2¹ to 2², labeled "Pile test loss."
- **Legend**: Located in the top-right corner, with:
- Blue dashed line: "7B 8k"
- Orange dashed line: "14B 8k"
### Detailed Analysis
#### 7B 8k (Blue Line)
- **Data Points**:
- 2¹: ~2.8
- 2³: ~1.8
- 2⁵: ~1.3
- 2⁷: ~1.1
- 2⁹: ~1.05
- 2¹¹: ~1.02
- **Trend**: Steep initial decline (2¹ to 2³), followed by gradual flattening. Loss stabilizes near 1.0 at 2¹¹.
#### 14B 8k (Orange Line)
- **Data Points**:
- 2¹: ~2.9
- 2³: ~1.9
- 2⁵: ~1.4
- 2⁷: ~1.2
- 2⁹: ~1.1
- 2¹¹: ~1.05
- **Trend**: Similar trajectory to 7B 8k but consistently higher loss values. Converges with 7B 8k at larger context lengths (2⁹–2¹¹).
### Key Observations
1. **Initial Disparity**: At 2¹ context length, 14B 8k exhibits ~3.6% higher loss than 7B 8k.
2. **Convergence**: Both models show near-identical performance (loss ~1.0–1.1) at 2⁹–2¹¹ context lengths.
3. **Logarithmic Scaling**: Exponential context length increases correlate with sub-linear reductions in pile test loss.
### Interpretation
The data suggests that larger model size (14B vs. 7B) initially incurs higher computational costs (higher loss) but achieves comparable performance to smaller models at extended context lengths. The logarithmic scaling reveals diminishing returns for increasing context length beyond 2⁵, as both models stabilize near baseline loss thresholds. This implies that model efficiency plateaus at larger scales, with context length having a more pronounced impact on early-stage performance than on stabilized outcomes.