## Chart: Transformer vs LSTM Performance
### Overview
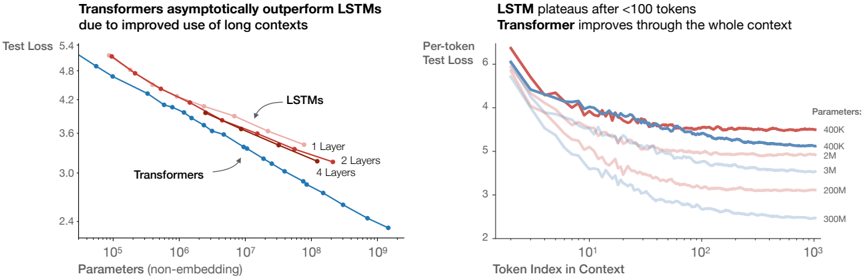
The image presents two line charts comparing the performance of Transformer and LSTM models. The left chart shows "Test Loss" versus "Parameters (non-embedding)", while the right chart shows "Per-token Test Loss" versus "Token Index in Context". The charts aim to illustrate how Transformers outperform LSTMs, especially with longer contexts and increased parameters.
### Components/Axes
**Left Chart:**
* **Title:** Transformers asymptotically outperform LSTMs due to improved use of long contexts
* **Y-axis:** Test Loss, with values ranging from 2.4 to 5.4.
* **X-axis:** Parameters (non-embedding), with a logarithmic scale from 10^5 to 10^9.
* **Data Series:**
* LSTMs: Represented by three lines:
* 1 Layer (light red)
* 2 Layers (red)
* 4 Layers (blue)
* Transformers: Represented by one line (blue).
**Right Chart:**
* **Title:** LSTM plateaus after <100 tokens. Transformer improves through the whole context.
* **Y-axis:** Per-token Test Loss, with values ranging from 2 to 6.
* **X-axis:** Token Index in Context, with a logarithmic scale from 10^0 to 10^3.
* **Data Series:**
* Parameters:
* 400K (red)
* 400K (blue)
* 2M (light red)
* 3M (light blue)
* 200M (light red)
* 300M (light blue)
### Detailed Analysis
**Left Chart:**
* **LSTMs (1 Layer):** Starts at approximately (10^5, 5.1) and decreases to approximately (10^9, 3.8).
* **LSTMs (2 Layers):** Starts at approximately (10^5, 5.2) and decreases to approximately (10^9, 3.5).
* **LSTMs (4 Layers):** Starts at approximately (10^5, 5.3) and decreases to approximately (10^9, 4.0).
* **Transformers:** Starts at approximately (10^5, 4.9) and decreases to approximately (10^9, 2.4).
**Right Chart:**
* **400K (red):** Starts at approximately (1, 6.2) and plateaus around 4.0 after 100 tokens.
* **400K (blue):** Starts at approximately (1, 5.9) and plateaus around 3.8 after 100 tokens.
* **2M (light red):** Starts at approximately (1, 5.7) and decreases to approximately 3.5 at 10^3.
* **3M (light blue):** Starts at approximately (1, 5.5) and decreases to approximately 3.0 at 10^3.
* **200M (light red):** Starts at approximately (1, 5.3) and decreases to approximately 2.8 at 10^3.
* **300M (light blue):** Starts at approximately (1, 5.1) and decreases to approximately 2.5 at 10^3.
### Key Observations
* In the left chart, Transformers consistently outperform LSTMs across all parameter ranges. The test loss for Transformers is significantly lower than that of LSTMs, especially as the number of parameters increases.
* In the right chart, LSTM models (400K parameters) plateau relatively quickly, while Transformer models (2M, 3M, 200M, 300M parameters) continue to improve (decrease in test loss) throughout the context.
* Increasing the number of layers in LSTMs does improve performance (lower test loss), but not to the same extent as using Transformers.
* Increasing the number of parameters in Transformers leads to a continuous decrease in test loss, indicating better performance with larger models.
### Interpretation
The data suggests that Transformers are more effective than LSTMs, particularly when dealing with long contexts and larger parameter sizes. The left chart demonstrates that Transformers achieve lower test loss compared to LSTMs for a given number of parameters. The right chart highlights that LSTMs plateau in performance after processing a limited number of tokens, while Transformers continue to improve as the context length increases. This indicates that Transformers are better at capturing long-range dependencies in the data. The charts support the claim that Transformers' architecture is better suited for tasks requiring the processing of long sequences, leading to improved performance compared to LSTMs.