## Histogram: Model Confidence vs. Accuracy on Various Tasks
### Overview
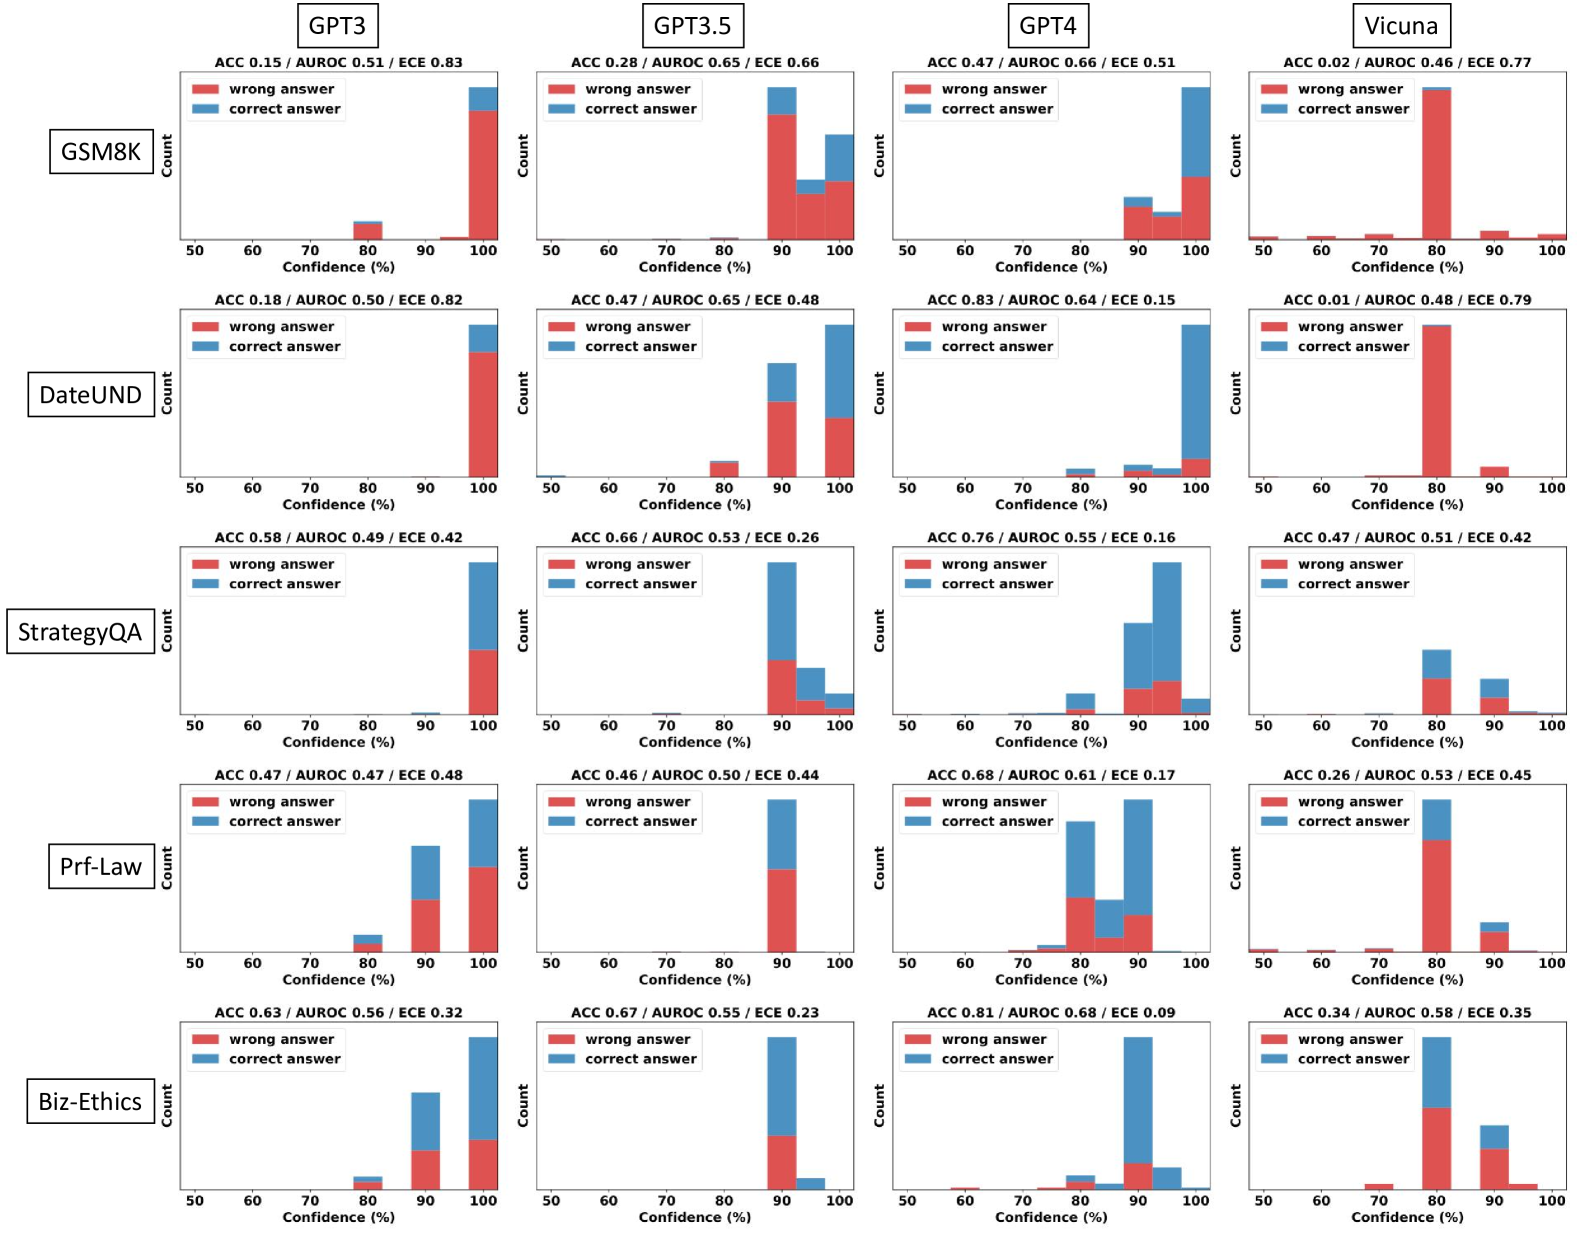
The image presents a series of histograms comparing the confidence levels of four language models (GPT3, GPT3.5, GPT4, and Vicuna) on six different tasks (GSM8K, DateUND, StrategyQA, Prf-Law, and Biz-Ethics). Each histogram shows the distribution of confidence scores for both correct and incorrect answers, allowing for a comparison of model calibration across different tasks and models.
### Components/Axes
* **Title:** Model Confidence vs. Accuracy on Various Tasks
* **X-axis:** Confidence (%), ranging from 50% to 100% in increments of 10%.
* **Y-axis:** Count (frequency of responses within each confidence bin).
* **Histograms:** Each subplot represents a combination of a language model and a task.
* **Legend:** Located within each subplot:
* Red: "wrong answer"
* Blue: "correct answer"
* **Metrics:** Each subplot includes the following metrics:
* ACC: Accuracy
* AUROC: Area Under the Receiver Operating Characteristic Curve
* ECE: Expected Calibration Error
* **Tasks (Y-Axis Labels):** GSM8K, DateUND, StrategyQA, Prf-Law, Biz-Ethics
* **Models (X-Axis Labels):** GPT3, GPT3.5, GPT4, Vicuna
### Detailed Analysis
**GSM8K**
* **GPT3:** ACC 0.15 / AUROC 0.51 / ECE 0.83. The majority of responses, both correct and incorrect, are clustered at 90-100% confidence. The "wrong answer" count is significantly higher than the "correct answer" count at high confidence.
* **GPT3.5:** ACC 0.28 / AUROC 0.65 / ECE 0.66. Similar to GPT3, most responses are at 90-100% confidence, with "wrong answers" being more frequent.
* **GPT4:** ACC 0.47 / AUROC 0.66 / ECE 0.51. Shows a more balanced distribution, with a noticeable number of "correct answers" at 90-100% confidence, but still dominated by "wrong answers" at high confidence.
* **Vicuna:** ACC 0.02 / AUROC 0.46 / ECE 0.77. Almost all responses are clustered at 70-80% confidence, with "wrong answers" dominating.
**DateUND**
* **GPT3:** ACC 0.18 / AUROC 0.50 / ECE 0.82. High confidence (90-100%) for most answers, with "wrong answers" being more frequent.
* **GPT3.5:** ACC 0.47 / AUROC 0.65 / ECE 0.48. High confidence (90-100%) for most answers, with a higher proportion of "correct answers" compared to GPT3.
* **GPT4:** ACC 0.83 / AUROC 0.64 / ECE 0.15. Most "correct answers" are at 90-100% confidence. "Wrong answers" are relatively infrequent.
* **Vicuna:** ACC 0.01 / AUROC 0.48 / ECE 0.79. Almost all responses are clustered at 70-80% confidence, with "wrong answers" dominating.
**StrategyQA**
* **GPT3:** ACC 0.58 / AUROC 0.49 / ECE 0.42. Most "correct answers" are at 90-100% confidence.
* **GPT3.5:** ACC 0.66 / AUROC 0.53 / ECE 0.26. Most "correct answers" are at 90-100% confidence.
* **GPT4:** ACC 0.76 / AUROC 0.55 / ECE 0.16. Most "correct answers" are at 90-100% confidence.
* **Vicuna:** ACC 0.47 / AUROC 0.51 / ECE 0.42. A mix of confidence levels, with a peak at 70-80% confidence.
**Prf-Law**
* **GPT3:** ACC 0.47 / AUROC 0.47 / ECE 0.48. A mix of confidence levels, with a peak at 90-100% confidence.
* **GPT3.5:** ACC 0.46 / AUROC 0.50 / ECE 0.44. A mix of confidence levels, with a peak at 90-100% confidence.
* **GPT4:** ACC 0.68 / AUROC 0.61 / ECE 0.17. A mix of confidence levels, with a peak at 80-90% confidence.
* **Vicuna:** ACC 0.26 / AUROC 0.53 / ECE 0.45. Most "wrong answers" are at 70-80% confidence.
**Biz-Ethics**
* **GPT3:** ACC 0.63 / AUROC 0.56 / ECE 0.32. Most "correct answers" are at 90-100% confidence.
* **GPT3.5:** ACC 0.67 / AUROC 0.55 / ECE 0.23. Most "correct answers" are at 90-100% confidence.
* **GPT4:** ACC 0.81 / AUROC 0.68 / ECE 0.09. Most "correct answers" are at 90-100% confidence.
* **Vicuna:** ACC 0.34 / AUROC 0.58 / ECE 0.35. A mix of confidence levels, with a peak at 70-80% confidence.
### Key Observations
* **Calibration Issues:** GPT3 and GPT3.5 tend to be overconfident, often assigning high confidence to incorrect answers, especially on GSM8K and DateUND.
* **GPT4 Improvement:** GPT4 generally shows better calibration, with higher accuracy and lower ECE scores. It tends to assign high confidence more often to correct answers.
* **Vicuna's Underconfidence:** Vicuna tends to cluster its responses around 70-80% confidence, regardless of the task or correctness of the answer. This suggests underconfidence.
* **Task Difficulty:** GSM8K and DateUND appear to be more challenging tasks, as indicated by the lower accuracy scores across all models.
* **AUROC Discrepancies:** The AUROC scores do not always correlate perfectly with accuracy, suggesting that the models' ability to discriminate between correct and incorrect answers varies.
### Interpretation
The histograms reveal significant differences in calibration among the four language models. GPT3 and GPT3.5 exhibit overconfidence, particularly on tasks like GSM8K and DateUND, where they frequently assign high confidence to incorrect answers. This suggests that these models are poorly calibrated and may not be reliable for tasks requiring accurate confidence estimation.
GPT4 demonstrates improved calibration compared to its predecessors, with higher accuracy and lower ECE scores. This indicates that GPT4 is better at aligning its confidence with its actual performance.
Vicuna, on the other hand, appears to be underconfident, clustering its responses around 70-80% confidence regardless of the task or correctness of the answer. This suggests that Vicuna may benefit from calibration techniques to improve its confidence estimation.
The task difficulty also plays a role, with GSM8K and DateUND being more challenging than the other tasks. This is reflected in the lower accuracy scores across all models for these tasks.
Overall, the histograms provide valuable insights into the calibration of different language models and highlight the importance of evaluating and improving model confidence estimation for reliable decision-making.