TECHNICAL ASSET FINGERPRINT
5e56a4846dcfab79b4d675ac
Click to view fullscreen
Press ESC or click to close
FOUND IN PAPERS
EXPERT: gemma-3-27b-it-free VERSION 1
RUNTIME: google-free/gemma-3-27b-it
INTEL_VERIFIED
## Chart: Confidence Histograms for LLM Performance on Various Benchmarks
### Overview
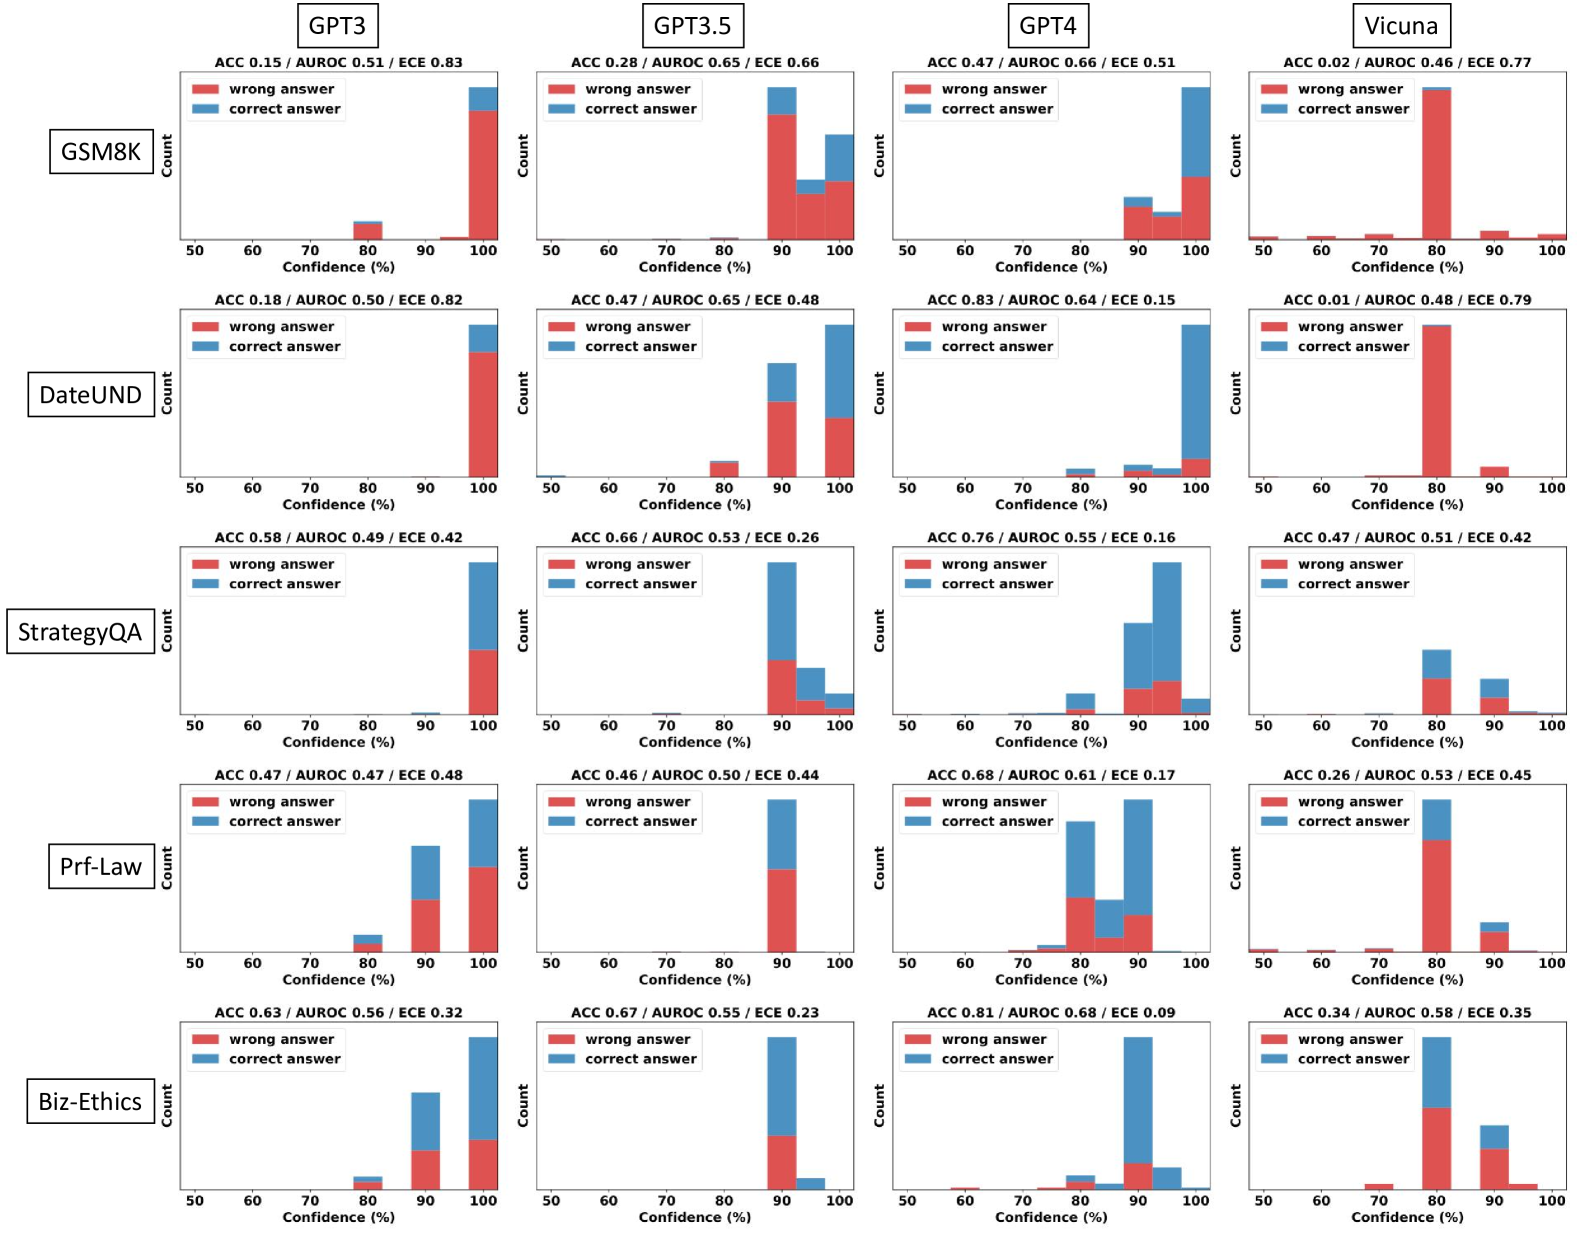
This image presents a 4x5 grid of histograms, each representing the distribution of confidence scores for different Large Language Models (LLMs) – GPT3, GPT3.5, GPT4, and Vicuna – across five different benchmarks: GSM8K, DateUND, StrategyQA, Prf-Law, and Lambada. Each histogram displays the count of predictions falling within specific confidence percentage ranges (50-60%, 60-70%, 70-80%, 80-90%, 90-100%). Each histogram has two lines representing "wrong answer" and "correct answer" predictions. Accuracy (ACC), Area Under the Receiver Operating Characteristic curve (AUROC), and Expected Calibration Error (ECE) are reported for each model/benchmark combination.
### Components/Axes
* **X-axis:** Confidence (%) - Ranges from 50% to 100%, divided into 10% bins.
* **Y-axis:** Count - Represents the number of predictions falling within each confidence bin.
* **Models (Columns):** GPT3, GPT3.5, GPT4, Vicuna.
* **Benchmarks (Rows):** GSM8K, DateUND, StrategyQA, Prf-Law, Lambada.
* **Legend:**
* Red: Wrong Answer
* Teal: Correct Answer
* **Metrics (Top of each chart):**
* ACC: Accuracy
* AUROC: Area Under the Receiver Operating Characteristic curve
* ECE: Expected Calibration Error
### Detailed Analysis or Content Details
Here's a breakdown of the data, row by row (Benchmark) and column by column (Model). Values are approximate, based on visual estimation.
**GSM8K:**
* **GPT3:** ACC 0.15 / AUROC 0.51 / ECE 0.83. The "wrong answer" line shows a peak around 60-70% confidence, with a count of approximately 40. The "correct answer" line peaks around 90-100% confidence, with a count of approximately 20.
* **GPT3.5:** ACC 0.28 / AUROC 0.56 / ECE 0.66. "Wrong answer" peaks around 60-70% (count ~30). "Correct answer" peaks around 80-90% (count ~25).
* **GPT4:** ACC 0.47 / AUROC 0.66 / ECE 0.51. "Wrong answer" peaks around 60-70% (count ~25). "Correct answer" peaks around 90-100% (count ~35).
* **Vicuna:** ACC 0.02 / AUROC 0.46 / ECE 0.77. "Wrong answer" peaks around 60-70% (count ~45). "Correct answer" peaks around 90-100% (count ~5).
**DateUND:**
* **GPT3:** ACC 0.19 / AUROC 0.50 / ECE 0.82. "Wrong answer" peaks around 60-70% (count ~35). "Correct answer" peaks around 90-100% (count ~20).
* **GPT3.5:** ACC 0.47 / AUROC 0.65 / ECE 0.48. "Wrong answer" peaks around 60-70% (count ~20). "Correct answer" peaks around 90-100% (count ~35).
* **GPT4:** ACC 0.83 / AUROC 0.64 / ECE 0.15. "Wrong answer" peaks around 60-70% (count ~5). "Correct answer" peaks around 90-100% (count ~50).
* **Vicuna:** ACC 0.01 / AUROC 0.48 / ECE 0.79. "Wrong answer" peaks around 60-70% (count ~50). "Correct answer" peaks around 90-100% (count ~5).
**StrategyQA:**
* **GPT3:** ACC 0.58 / AUROC 0.49 / ECE 0.42. "Wrong answer" peaks around 60-70% (count ~25). "Correct answer" peaks around 80-90% (count ~30).
* **GPT3.5:** ACC 0.66 / AUROC 0.53 / ECE 0.26. "Wrong answer" peaks around 60-70% (count ~20). "Correct answer" peaks around 80-90% (count ~35).
* **GPT4:** ACC 0.76 / AUROC 0.55 / ECE 0.16. "Wrong answer" peaks around 60-70% (count ~15). "Correct answer" peaks around 90-100% (count ~40).
* **Vicuna:** ACC 0.47 / AUROC 0.51 / ECE 0.42. "Wrong answer" peaks around 60-70% (count ~30). "Correct answer" peaks around 80-90% (count ~25).
**Prf-Law:**
* **GPT3:** ACC 0.47 / AUROC 0.47 / ECE 0.44. "Wrong answer" peaks around 60-70% (count ~30). "Correct answer" peaks around 80-90% (count ~25).
* **GPT3.5:** ACC 0.66 / AUROC 0.52 / ECE 0.31. "Wrong answer" peaks around 60-70% (count ~20). "Correct answer" peaks around 80-90% (count ~35).
* **GPT4:** ACC 0.83 / AUROC 0.64 / ECE 0.10. "Wrong answer" peaks around 60-70% (count ~5). "Correct answer" peaks around 90-100% (count ~50).
* **Vicuna:** ACC 0.26 / AUROC 0.53 / ECE 0.48. "Wrong answer" peaks around 60-70% (count ~35). "Correct answer" peaks around 80-90% (count ~20).
**Lambada:**
* **GPT3:** ACC 0.58 / AUROC 0.52 / ECE 0.36. "Wrong answer" peaks around 60-70% (count ~25). "Correct answer" peaks around 80-90% (count ~30).
* **GPT3.5:** ACC 0.66 / AUROC 0.58 / ECE 0.28. "Wrong answer" peaks around 60-70% (count ~20). "Correct answer" peaks around 80-90% (count ~35).
* **GPT4:** ACC 0.83 / AUROC 0.66 / ECE 0.09. "Wrong answer" peaks around 60-70% (count ~5). "Correct answer" peaks around 90-100% (count ~50).
* **Vicuna:** ACC 0.47 / AUROC 0.55 / ECE 0.34. "Wrong answer" peaks around 60-70% (count ~30). "Correct answer" peaks around 80-90% (count ~25).
### Key Observations
* **GPT4 consistently outperforms other models** across all benchmarks, exhibiting the highest accuracy and lowest ECE. Its "correct answer" distribution is heavily skewed towards higher confidence levels (90-100%).
* **Vicuna generally has the lowest accuracy** and highest ECE, with its "wrong answer" distribution peaking at lower confidence levels.
* **GPT3.5 shows improvement over GPT3** in most benchmarks, but remains significantly behind GPT4.
* **ECE generally decreases as accuracy increases.** This suggests a correlation between calibration and performance.
* The "wrong answer" distributions often peak in the 60-70% confidence range, indicating that the models are often confidently incorrect.
### Interpretation
The data demonstrates a clear hierarchy in the performance of these LLMs. GPT4 is significantly more accurate and better calibrated than the other models, suggesting a superior ability to both solve the tasks and estimate its own uncertainty. The consistently low performance of Vicuna highlights the challenges in achieving strong results with smaller or differently trained models. The fact that incorrect answers are often given with high confidence (60-70% range) across all models is a critical issue, as it suggests that users may be misled by the models' outputs. The ECE metric provides a quantitative measure of this miscalibration. The trend of decreasing ECE with increasing accuracy suggests that improving model performance also leads to better calibration. This data is valuable for understanding the strengths and weaknesses of different LLMs and for developing strategies to improve their reliability and trustworthiness. The consistent performance of GPT4 across all benchmarks suggests a robust general-purpose capability, while the varying performance of other models across benchmarks indicates that their strengths and weaknesses are more task-specific.
DECODING INTELLIGENCE...