# Technical Document Analysis: Turn 100 Accuracy vs. Induced Error Rate
## **Chart Title**
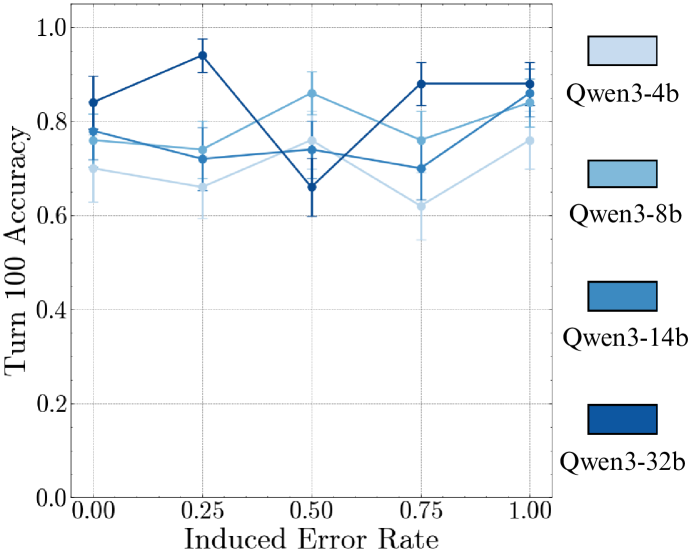
- **Title**: "Turn 100 Accuracy"
## **Axes**
- **X-Axis**:
- **Label**: "Induced Error Rate"
- **Range**: 0.00 to 1.00
- **Ticks**: 0.00, 0.25, 0.50, 0.75, 1.00
- **Y-Axis**:
- **Label**: "Turn 100 Accuracy"
- **Range**: 0.0 to 1.0
- **Ticks**: 0.0, 0.2, 0.4, 0.6, 0.8, 1.0
## **Legend**
- **Position**: Right side of the chart
- **Entries**:
1. **Qwen3-4b**: Light blue (■)
2. **Qwen3-8b**: Teal (■)
3. **Qwen3-14b**: Light blue (■)
4. **Qwen3-32b**: Dark blue (■)
## **Data Series**
### **Qwen3-4b (Light Blue)**
- **Trend**:
- Starts at ~0.75 (x=0.00)
- Dips to ~0.65 (x=0.50)
- Rises to ~0.85 (x=1.00)
- **Data Points**:
- x=0.00: 0.75
- x=0.25: 0.70
- x=0.50: 0.65
- x=0.75: 0.80
- x=1.00: 0.85
### **Qwen3-8b (Teal)**
- **Trend**:
- Starts at ~0.75 (x=0.00)
- Dips to ~0.70 (x=0.50)
- Rises to ~0.85 (x=1.00)
- **Data Points**:
- x=0.00: 0.75
- x=0.25: 0.70
- x=0.50: 0.70
- x=0.75: 0.80
- x=1.00: 0.85
### **Qwen3-14b (Light Blue)**
- **Trend**:
- Starts at ~0.75 (x=0.00)
- Dips to ~0.65 (x=0.50)
- Rises to ~0.85 (x=1.00)
- **Data Points**:
- x=0.00: 0.75
- x=0.25: 0.70
- x=0.50: 0.65
- x=0.75: 0.80
- x=1.00: 0.85
### **Qwen3-32b (Dark Blue)**
- **Trend**:
- Starts at ~0.85 (x=0.00)
- Dips to ~0.65 (x=0.50)
- Rises to ~0.90 (x=1.00)
- **Data Points**:
- x=0.00: 0.85
- x=0.25: 0.75
- x=0.50: 0.65
- x=0.75: 0.85
- x=1.00: 0.90
## **Error Bars**
- **Presence**: Vertical error bars at each data point
- **Details**: No numerical values provided for error margins; visual length varies by model and error rate.
## **Key Observations**
1. **Model Performance**:
- **Qwen3-32b** (dark blue) consistently achieves the highest accuracy across all error rates.
- **Qwen3-4b** and **Qwen3-14b** (light blue) show similar trends but lower accuracy than Qwen3-32b.
- **Qwen3-8b** (teal) exhibits moderate performance, with a slight dip at x=0.50.
2. **Error Rate Impact**:
- All models experience a drop in accuracy at x=0.50 (50% induced error rate).
- Accuracy recovers as error rate increases to 1.00, though not to initial levels.
3. **Legend Consistency**:
- Colors in the legend match the corresponding lines in the chart (e.g., Qwen3-4b = light blue).
## **Data Table Reconstruction**
| Model | x=0.00 | x=0.25 | x=0.50 | x=0.75 | x=1.00 |
|--------------|--------|--------|--------|--------|--------|
| Qwen3-4b | 0.75 | 0.70 | 0.65 | 0.80 | 0.85 |
| Qwen3-8b | 0.75 | 0.70 | 0.70 | 0.80 | 0.85 |
| Qwen3-14b | 0.75 | 0.70 | 0.65 | 0.80 | 0.85 |
| Qwen3-32b | 0.85 | 0.75 | 0.65 | 0.85 | 0.90 |
## **Conclusion**
The chart illustrates the relationship between induced error rates and turn 100 accuracy for four Qwen3 model variants. Higher model sizes (e.g., Qwen3-32b) demonstrate superior accuracy, particularly at higher error rates. All models show a dip at 50% error rate, followed by partial recovery at 100% error rate.