## Line Chart: Accuracy vs. Thinking Compute
### Overview
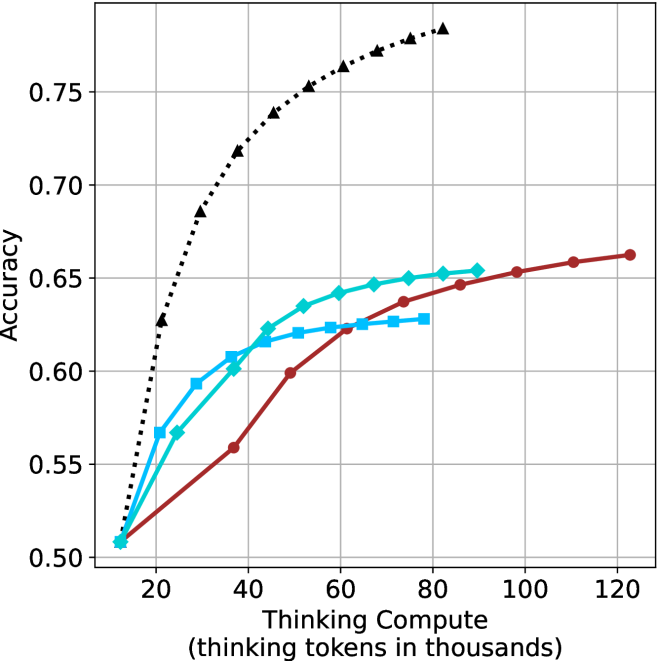
This image presents a line chart illustrating the relationship between "Thinking Compute" (measured in thousands of tokens) and "Accuracy". The chart displays four distinct data series, each represented by a different colored line, showing how accuracy changes as thinking compute increases.
### Components/Axes
* **X-axis:** "Thinking Compute (thinking tokens in thousands)". Scale ranges from approximately 0 to 120, with markers at 20, 40, 60, 80, 100, and 120.
* **Y-axis:** "Accuracy". Scale ranges from approximately 0.50 to 0.76, with markers at 0.50, 0.55, 0.60, 0.65, 0.70, and 0.75.
* **Data Series:** Four lines are present, each with a unique color and marker style:
* Black dashed line with diamond markers.
* Cyan solid line with circle markers.
* Red solid line with square markers.
* Blue dashed line with triangle markers.
* **Legend:** There is no explicit legend present in the image.
### Detailed Analysis
Let's analyze each data series individually:
* **Black Dashed Line (Diamond Markers):** This line exhibits the most rapid increase in accuracy. It starts at approximately (15, 0.53) and quickly rises to a peak around (40, 0.74), then plateaus, reaching approximately (120, 0.76).
* **Cyan Solid Line (Circle Markers):** This line shows a moderate increase in accuracy. It begins at approximately (15, 0.55) and steadily climbs to around (120, 0.65). The slope is relatively consistent throughout.
* **Red Solid Line (Square Markers):** This line demonstrates a slower, but consistent, increase in accuracy. It starts at approximately (15, 0.52) and gradually rises to around (120, 0.63).
* **Blue Dashed Line (Triangle Markers):** This line shows an initial increase, then plateaus. It begins at approximately (15, 0.57) and rises to around (60, 0.63), then remains relatively constant until (120, 0.63).
Approximate Data Points:
| Thinking Compute (thousands) | Black (Accuracy) | Cyan (Accuracy) | Red (Accuracy) | Blue (Accuracy) |
|---|---|---|---|---|
| 15 | 0.53 | 0.55 | 0.52 | 0.57 |
| 20 | 0.60 | 0.58 | 0.54 | 0.60 |
| 30 | 0.68 | 0.61 | 0.58 | 0.62 |
| 40 | 0.74 | 0.63 | 0.60 | 0.63 |
| 50 | 0.75 | 0.64 | 0.61 | 0.63 |
| 60 | 0.75 | 0.64 | 0.62 | 0.63 |
| 70 | 0.75 | 0.65 | 0.62 | 0.63 |
| 80 | 0.75 | 0.65 | 0.63 | 0.63 |
| 90 | 0.76 | 0.65 | 0.63 | 0.63 |
| 100 | 0.76 | 0.65 | 0.63 | 0.63 |
| 110 | 0.76 | 0.65 | 0.63 | 0.63 |
| 120 | 0.76 | 0.65 | 0.63 | 0.63 |
### Key Observations
* The black dashed line consistently outperforms the other three lines in terms of accuracy.
* The red solid line exhibits the slowest rate of improvement in accuracy.
* The blue dashed line shows a diminishing return on accuracy gains after approximately 60 thousand thinking tokens.
* All lines demonstrate an overall positive correlation between thinking compute and accuracy, but with varying degrees of sensitivity.
### Interpretation
The chart suggests that increasing "Thinking Compute" generally leads to improved "Accuracy". However, the rate of improvement varies significantly depending on the specific data series. The black dashed line indicates a method or model that benefits substantially from increased compute, achieving high accuracy relatively quickly. The cyan line shows a steady, moderate improvement, while the red line suggests a method that is less sensitive to increased compute. The blue line indicates a point of diminishing returns, where further increases in compute do not yield significant accuracy gains.
This data could represent the performance of different machine learning models or algorithms as they are given more computational resources for "thinking" (e.g., processing information, making inferences). The differences in performance could be due to variations in model architecture, training data, or optimization techniques. The plateau observed in the blue line suggests that the model has reached its capacity or is limited by other factors, such as the quality of the training data. The rapid initial gains of the black line could indicate a model that is highly scalable and benefits greatly from increased compute.