\n
## Line Chart: Accuracy vs. Thinking Compute
### Overview
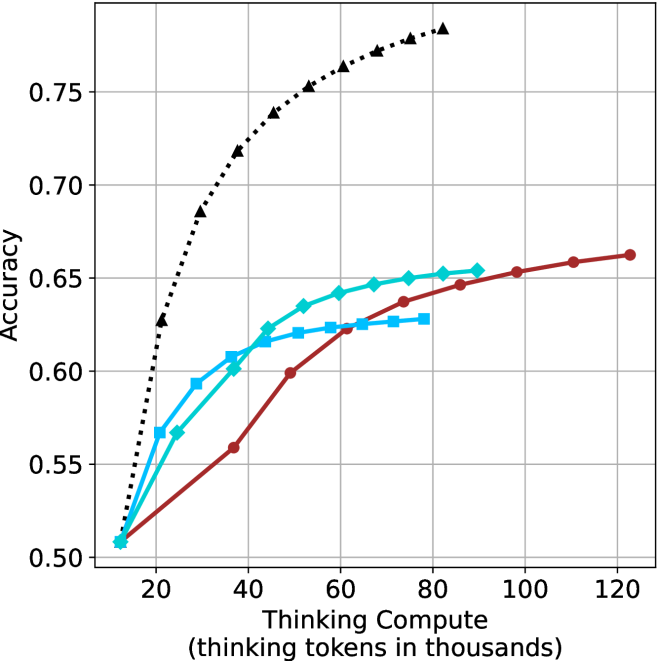
The image is a line chart plotting model accuracy against computational effort, measured in thinking tokens. It displays four distinct data series, each represented by a different colored line with unique markers, showing how accuracy scales with increased "thinking compute." The chart demonstrates a clear positive correlation between compute and accuracy for all series, but with varying rates of improvement and performance ceilings.
### Components/Axes
* **X-Axis (Horizontal):**
* **Label:** "Thinking Compute (thinking tokens in thousands)"
* **Scale:** Linear scale from 0 to 120, with major tick marks and grid lines at intervals of 20 (0, 20, 40, 60, 80, 100, 120).
* **Y-Axis (Vertical):**
* **Label:** "Accuracy"
* **Scale:** Linear scale from 0.50 to approximately 0.78, with major tick marks and grid lines at intervals of 0.05 (0.50, 0.55, 0.60, 0.65, 0.70, 0.75).
* **Data Series (Legend inferred from visual markers):**
1. **Black, dotted line with upward-pointing triangle markers (▲).** Positioned as the top-most line.
2. **Cyan (light blue) solid line with diamond markers (◆).** Positioned in the middle-upper range.
3. **Cyan (light blue) solid line with square markers (■).** Positioned just below the diamond-marked cyan line.
4. **Dark red solid line with circle markers (●).** Starts as the lowest line but crosses above the square-marked cyan line at higher compute values.
### Detailed Analysis
**Trend Verification & Data Point Extraction (Approximate Values):**
1. **Black Dotted Line (▲):**
* **Trend:** Shows the steepest initial ascent and continues to rise throughout the charted range, maintaining the highest accuracy at every compute level after the initial point.
* **Key Points:**
* At ~10k tokens: Accuracy ≈ 0.51
* At ~20k tokens: Accuracy ≈ 0.63
* At ~40k tokens: Accuracy ≈ 0.72
* At ~60k tokens: Accuracy ≈ 0.76
* At ~80k tokens: Accuracy ≈ 0.78 (highest point on the chart)
2. **Cyan Line with Diamonds (◆):**
* **Trend:** Rises steadily, with a slightly decreasing slope, and appears to plateau near the end of its plotted range.
* **Key Points:**
* At ~10k tokens: Accuracy ≈ 0.51
* At ~30k tokens: Accuracy ≈ 0.60
* At ~50k tokens: Accuracy ≈ 0.64
* At ~70k tokens: Accuracy ≈ 0.65
* At ~90k tokens: Accuracy ≈ 0.655 (final point)
3. **Cyan Line with Squares (■):**
* **Trend:** Follows a similar trajectory to the diamond-marked cyan line but consistently achieves slightly lower accuracy. It also shows signs of plateauing.
* **Key Points:**
* At ~10k tokens: Accuracy ≈ 0.51
* At ~25k tokens: Accuracy ≈ 0.59
* At ~45k tokens: Accuracy ≈ 0.62
* At ~65k tokens: Accuracy ≈ 0.625
* At ~80k tokens: Accuracy ≈ 0.63 (final point)
4. **Dark Red Line with Circles (●):**
* **Trend:** Starts with the shallowest slope, lagging behind the cyan lines initially. However, it maintains a more consistent upward trajectory, eventually crossing above the square-marked cyan line around 65k tokens and continuing to rise.
* **Key Points:**
* At ~10k tokens: Accuracy ≈ 0.51
* At ~40k tokens: Accuracy ≈ 0.56
* At ~60k tokens: Accuracy ≈ 0.62
* At ~80k tokens: Accuracy ≈ 0.645
* At ~100k tokens: Accuracy ≈ 0.655
* At ~120k tokens: Accuracy ≈ 0.665 (final point, highest among non-black lines)
### Key Observations
1. **Universal Scaling Law:** All four methods show improved accuracy with increased thinking compute, suggesting a fundamental relationship between computational resources allocated to "thinking" and task performance.
2. **Performance Hierarchy:** A clear and consistent performance gap exists. The method represented by the black dotted line (▲) is significantly more compute-efficient, achieving much higher accuracy at every token budget.
3. **Diminishing Returns:** All curves exhibit diminishing returns; the slope (accuracy gain per additional thousand tokens) decreases as compute increases. This is most pronounced in the two cyan lines, which appear to approach an asymptote.
4. **Crossover Event:** The dark red line (●) demonstrates a different scaling profile. While less efficient at low compute, its more sustained improvement allows it to surpass the square-marked cyan line (■) at approximately 65k tokens, indicating it may have a higher performance ceiling with sufficient compute.
5. **Convergence at Origin:** All lines originate from approximately the same point (~10k tokens, ~0.51 accuracy), suggesting a common baseline performance with minimal thinking compute.
### Interpretation
This chart visualizes the **trade-off between computational cost and model performance** for different reasoning or "thinking" methodologies. The data suggests:
* **Methodological Superiority:** The approach behind the black dotted line is fundamentally more effective at converting thinking tokens into accuracy gains. This could indicate a more efficient architecture, better training, or a superior reasoning algorithm.
* **The Cost of Accuracy:** Achieving higher accuracy requires exponentially more compute. Moving from 0.65 to 0.78 accuracy (for the black line) requires roughly doubling the token budget from ~40k to ~80k.
* **Strategic Choice:** The optimal method depends on the available compute budget. For constrained environments (<60k tokens), the cyan methods (diamond or square) are competitive with each other and better than the red method. For unconstrained environments where maximum accuracy is the goal, the black method is unequivocally best. The red method presents an interesting case where investing in very high compute (>80k tokens) yields continued, albeit slow, gains that other plateauing methods cannot match.
* **Underlying Principle:** The chart provides empirical support for the hypothesis that allocating more tokens for internal "thinking" or chain-of-thought processing improves outcomes, a key concept in scaling language model capabilities. The variance between lines highlights that *how* those tokens are used is as important as *how many* are used.