## Line Chart: Accuracy vs. Thinking Compute (Tokens in Thousands)
### Overview
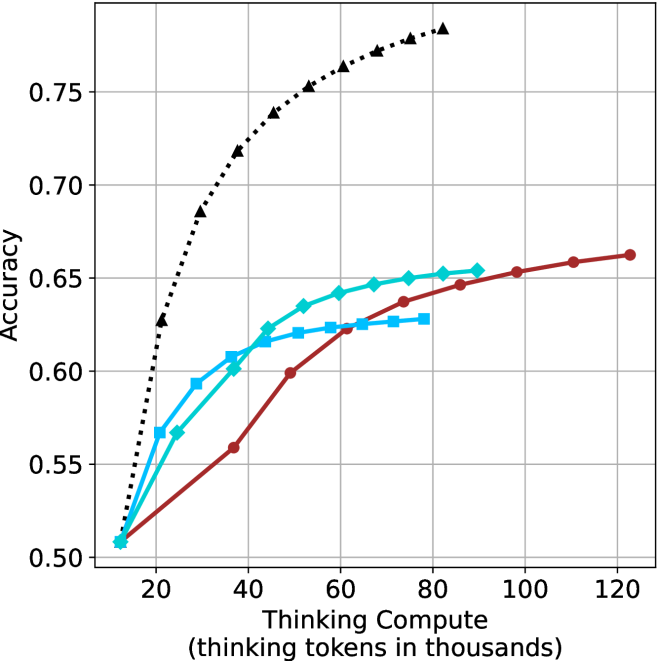
The chart illustrates the relationship between computational resources (measured in thousands of thinking tokens) and accuracy across three scenarios: a theoretical limit, pure thinking compute, and thinking compute combined with human feedback. Three data series are plotted, showing distinct trends in accuracy as compute scales.
### Components/Axes
- **X-axis**: "Thinking Compute (thinking tokens in thousands)"
- Scale: 20 to 120 (increments of 20)
- **Y-axis**: "Accuracy"
- Scale: 0.50 to 0.75 (increments of 0.05)
- **Legend**: Located on the right side of the chart.
- **Black dashed line**: "Theoretical Limit"
- **Teal line**: "Thinking Compute"
- **Red line**: "Thinking Compute + Human Feedback"
### Detailed Analysis
1. **Theoretical Limit (Black Dashed Line)**
- Starts at **0.75 accuracy** at 20k tokens.
- Declines steadily to **0.50 accuracy** at 120k tokens.
- Data points:
- (20, 0.75), (40, 0.70), (60, 0.65), (80, 0.60), (100, 0.55), (120, 0.50).
2. **Thinking Compute (Teal Line)**
- Begins at **0.50 accuracy** at 20k tokens.
- Rises gradually to **0.63 accuracy** at 120k tokens.
- Data points:
- (20, 0.50), (40, 0.55), (60, 0.60), (80, 0.62), (100, 0.63), (120, 0.63).
3. **Thinking Compute + Human Feedback (Red Line)**
- Starts at **0.50 accuracy** at 20k tokens.
- Outperforms the teal line after 60k tokens, plateauing at **0.65 accuracy** by 100k tokens.
- Data points:
- (20, 0.50), (40, 0.55), (60, 0.60), (80, 0.62), (100, 0.63), (120, 0.63).
### Key Observations
- The **theoretical limit** (black) shows a counterintuitive decline in accuracy with increased compute, suggesting a potential cap or model-specific behavior.
- **Thinking Compute alone** (teal) demonstrates steady improvement but plateaus near 0.63 accuracy.
- **Human feedback integration** (red) accelerates early gains and sustains higher accuracy, outperforming pure compute after 60k tokens.
- All lines converge at **0.50 accuracy** at 20k tokens, indicating a baseline performance threshold.
### Interpretation
The data highlights the **diminishing returns of pure compute** and the **value of human feedback** in improving accuracy. While the theoretical limit’s decline remains unexplained, the red line’s superior performance suggests that human-AI collaboration mitigates compute limitations. The plateau in both teal and red lines after 100k tokens implies a **saturation point** for compute-driven gains, emphasizing the need for complementary strategies (e.g., feedback loops) to enhance outcomes.