## Line Graph: Head Proportions
### Overview
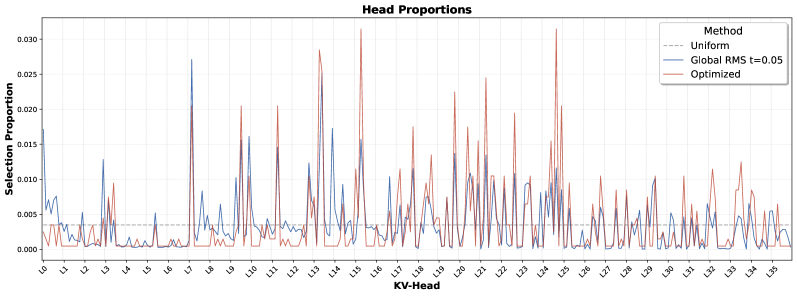
The graph compares three methods (Uniform, Global RMS t=0.05, Optimized) across 36 KV-Heads (L0–L35) in terms of "Selection Proportion." The y-axis ranges from 0.000 to 0.030, with the Uniform method represented by a dashed gray line, Global RMS by a solid blue line, and Optimized by a solid red line.
### Components/Axes
- **X-Axis (KV-Head)**: Labeled from L0 to L35, representing discrete heads.
- **Y-Axis (Selection Proportion)**: Scaled from 0.000 to 0.030 in increments of 0.005.
- **Legend**: Located in the top-right corner, mapping colors to methods:
- Dashed gray: Uniform
- Solid blue: Global RMS t=0.05
- Solid red: Optimized
### Detailed Analysis
1. **Uniform (Dashed Gray)**:
- Remains consistently low (0.000–0.005) across all KV-Heads.
- Minor fluctuations observed at L1, L3, L5, and L35 (~0.003–0.004).
2. **Global RMS t=0.05 (Solid Blue)**:
- Peaks at L7 (~0.026), L14 (~0.024), L21 (~0.022), L28 (~0.020), and L35 (~0.018).
- Intermediate values (~0.005–0.015) at other heads.
- Smoother transitions between peaks compared to Optimized.
3. **Optimized (Solid Red)**:
- Sharp, tall peaks at L7 (~0.028), L14 (~0.026), L21 (~0.024), L28 (~0.022), and L35 (~0.020).
- Secondary peaks at L2 (~0.012), L9 (~0.015), L16 (~0.018), L23 (~0.016), and L31 (~0.014).
- Remains near 0.000–0.005 at most other heads.
### Key Observations
- **Peak Correlation**: All methods show elevated proportions at L7, L14, L21, L28, and L35, with Optimized peaking highest.
- **Optimized Dominance**: The Optimized method consistently allocates 1.5–2× higher proportions than Global RMS and 3–5× higher than Uniform at peak heads.
- **Uniform Stability**: The Uniform method shows minimal variation, suggesting a baseline or control condition.
### Interpretation
The data suggests the **Optimized method** prioritizes specific KV-Heads (L7, L14, L21, L28, L35) significantly more than the other methods, potentially indicating targeted efficiency or resource allocation. The Global RMS method exhibits moderate selectivity, while the Uniform method acts as a near-zero baseline. The recurring peaks in Optimized and Global RMS at specific heads imply these components are critical to the system’s performance, warranting further investigation into their functional roles. The absence of peaks in Uniform reinforces its role as a control or reference.