## Flowchart: Sequential Decision Process
### Overview
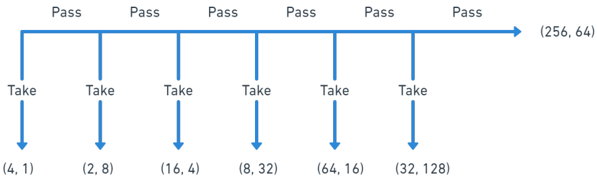
The image depicts a horizontal flowchart with a central "Pass" line and six vertical "Take" arrows branching downward. Each "Take" arrow leads to a pair of numerical values in parentheses. The final arrow points to the pair **(256, 64)**. The flowchart uses blue lines for both "Pass" and "Take" elements, with no explicit legend or color differentiation.
### Components/Axes
- **Horizontal Line**: Labeled "Pass" in blue, spanning the entire width of the chart.
- **Vertical Arrows**: Six blue arrows labeled "Take," each connecting the "Pass" line to a numerical pair below.
- **Numerical Pairs**: Six pairs of integers in parentheses, positioned directly below each "Take" arrow.
- **Final Arrow**: A seventh "Take" arrow extends beyond the main line to the pair **(256, 64)**.
### Detailed Analysis
1. **Numerical Pairs**:
- **(4, 1)**
- **(2, 8)**
- **(16, 4)**
- **(8, 32)**
- **(64, 16)**
- **(32, 128)**
- **(256, 64)** (final pair)
2. **Trends**:
- The first number in each pair alternates between **halving** and **doubling**:
- 4 → 2 (halve) → 16 (multiply by 8) → 8 (halve) → 64 (multiply by 8) → 32 (halve) → 256 (multiply by 8).
- The second number alternates between **multiplying by 8** and **halving**:
- 1 → 8 (×8) → 4 (÷2) → 32 (×8) → 16 (÷2) → 128 (×8) → 64 (÷2).
3. **Flow Logic**:
- The "Pass" line represents a continuous process, while each "Take" decision modifies the numerical state.
- The final pair **(256, 64)** suggests a cyclical or exponential pattern, with the first number doubling and the second halving relative to the previous step.
### Key Observations
- The numerical pairs follow a strict alternating pattern of operations (halving/doubling and multiplying/halving).
- The final pair **(256, 64)** is the only one where both numbers are powers of 2, reinforcing the exponential theme.
- No explicit labels or legends clarify the purpose of the numbers or the "Pass"/"Take" decisions.
### Interpretation
This flowchart likely represents a **binary or exponential process** where each "Take" decision alters the state of two variables in a predictable, alternating manner. The final pair **(256, 64)** could symbolize a terminal state or a reset condition, given its alignment with powers of 2. The lack of contextual labels (e.g., "Time," "Value," "State") limits direct interpretation, but the pattern suggests a computational or algorithmic workflow, such as:
- A **binary tree traversal** with alternating operations.
- A **state machine** where "Pass" represents inaction and "Take" triggers state transitions.
- A **simplified model** of exponential growth/decay in a system with two interdependent variables.
The absence of a legend or axis labels makes it challenging to assign real-world meaning, but the structured numerical pattern implies a deliberate, rule-based process.