\n
## Diagram: Sequential Pass/Take Process
### Overview
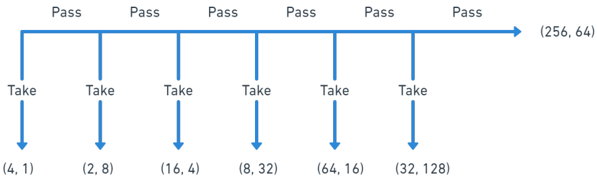
The image depicts a sequential process with alternating "Pass" and "Take" actions. A horizontal blue arrow indicates the progression of the process, with "Pass" labels positioned above and "Take" labels below. Each step is associated with a pair of numerical values enclosed in parentheses. The final value on the right side of the arrow is (256, 64).
### Components/Axes
The diagram consists of:
* A horizontal blue arrow representing the process flow.
* Six "Pass" labels positioned above the arrow, equally spaced.
* Six "Take" labels positioned below the arrow, equally spaced and aligned with the "Pass" labels.
* Six pairs of numerical values associated with each "Take" label: (4, 1), (2, 8), (16, 4), (8, 32), (64, 16), (32, 128).
* A final numerical value associated with the end of the arrow: (256, 64).
### Detailed Analysis
The diagram shows a series of six iterations where a "Take" action is followed by a "Pass" action. The numerical values associated with each "Take" action appear to represent a state or measurement.
Here's a breakdown of the values:
1. **Take (4, 1)**
2. **Pass**
3. **Take (2, 8)**
4. **Pass**
5. **Take (16, 4)**
6. **Pass**
7. **Take (8, 32)**
8. **Pass**
9. **Take (64, 16)**
10. **Pass**
11. **Take (32, 128)**
12. **Pass (256, 64)**
The first value in each pair generally increases as the process progresses, while the second value fluctuates. Specifically:
* The first values are: 4, 2, 16, 8, 64, 32, 256.
* The second values are: 1, 8, 4, 32, 16, 128, 64.
### Key Observations
* The process consistently alternates between "Take" and "Pass" actions.
* The first numerical value in the "Take" pairs shows a non-linear increase, with significant jumps between steps 2-3 and 5-6.
* The second numerical value in the "Take" pairs fluctuates, showing no clear trend.
* The final "Pass" value (256, 64) is significantly larger than the preceding "Take" values.
### Interpretation
This diagram likely represents a filtering or selection process. The "Take" actions could represent sampling or selecting data points, while the "Pass" actions represent accepting or rejecting those points based on some criteria. The numerical values could represent measurements or features of the data points.
The increasing first value in the "Take" pairs suggests that the process is progressively selecting data points with higher values for the first feature. The fluctuating second value indicates that the second feature does not have a consistent relationship with the selection process.
The final "Pass" value (256, 64) being significantly larger than the preceding values could indicate that the process has converged on a set of data points with high values for both features.
Without further context, it's difficult to determine the specific meaning of the "Take" and "Pass" actions or the numerical values. However, the diagram suggests a sequential filtering process that progressively selects data points based on their features.