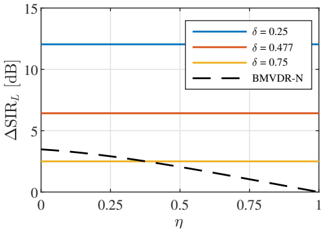
## Line Chart: Delta SIR_L vs. Eta
### Overview
The image is a line chart displaying the relationship between Delta SIR_L (in dB) and Eta (η). There are four data series represented by different colored lines: blue (δ = 0.25), red (δ = 0.477), yellow (δ = 0.75), and a black dashed line (BMVDR-N). The chart shows how Delta SIR_L changes with respect to Eta for different values of δ and for the BMVDR-N method.
### Components/Axes
* **X-axis (Horizontal):** Eta (η), ranging from 0 to 1 in increments of 0.25.
* **Y-axis (Vertical):** Delta SIR_L (ΔSIR_L) in dB, ranging from 0 to 15 in increments of 5.
* **Legend:** Located in the top-right corner of the chart.
* Blue line: δ = 0.25
* Red line: δ = 0.477
* Yellow line: δ = 0.75
* Black dashed line: BMVDR-N
### Detailed Analysis
* **Blue Line (δ = 0.25):** This line is horizontal, indicating a constant value of Delta SIR_L across all values of Eta. The value is approximately 12 dB.
* **Red Line (δ = 0.477):** This line is also horizontal, indicating a constant value of Delta SIR_L across all values of Eta. The value is approximately 7 dB.
* **Yellow Line (δ = 0.75):** This line is horizontal, indicating a constant value of Delta SIR_L across all values of Eta. The value is approximately 2 dB.
* **Black Dashed Line (BMVDR-N):** This line slopes downward, indicating a decreasing value of Delta SIR_L as Eta increases.
* At η = 0, Delta SIR_L is approximately 4 dB.
* At η = 0.25, Delta SIR_L is approximately 3 dB.
* At η = 0.5, Delta SIR_L is approximately 2 dB.
* At η = 0.75, Delta SIR_L is approximately 1 dB.
* At η = 1, Delta SIR_L is approximately 0.5 dB.
### Key Observations
* The Delta SIR_L values for fixed δ (0.25, 0.477, 0.75) remain constant regardless of the Eta value.
* The BMVDR-N method shows a decreasing Delta SIR_L as Eta increases.
* The Delta SIR_L values for different δ values are distinct and do not overlap.
### Interpretation
The chart compares the performance of different configurations (δ = 0.25, 0.477, 0.75) against the BMVDR-N method in terms of Delta SIR_L as Eta varies. The constant Delta SIR_L for fixed δ values suggests that these configurations are not affected by changes in Eta. In contrast, the BMVDR-N method's performance decreases as Eta increases, indicating a sensitivity to this parameter. The higher Delta SIR_L values for lower δ values (0.25) suggest better performance compared to higher δ values (0.75). The BMVDR-N method's performance is comparable to δ = 0.75 at lower Eta values but degrades as Eta increases.