## Line Graph: ΔSIR_L vs. η with δ Parameters and BMVDR-N Performance
### Overview
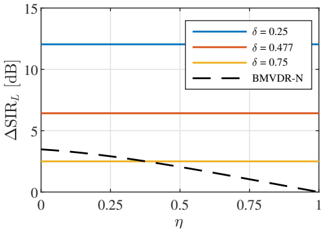
The image is a line graph comparing the change in Signal-to-Interference-plus-Noise Ratio (ΔSIR_L) in decibels (dB) across different values of η (normalized parameter, 0 to 1). Four data series are plotted: three horizontal lines representing constant δ values (0.25, 0.477, 0.75) and one dashed line labeled "BMVDR-N" showing a declining trend.
### Components/Axes
- **Y-axis**: ΔSIR_L [dB], scaled from 0 to 15 dB in increments of 5.
- **X-axis**: η (normalized parameter), scaled from 0 to 1 in increments of 0.25.
- **Legend**: Located in the top-right corner, with four entries:
- Blue line: δ = 0.25
- Red line: δ = 0.477
- Orange line: δ = 0.75
- Black dashed line: BMVDR-N
### Detailed Analysis
1. **δ = 0.25 (Blue Line)**:
- Constant at ~12 dB across all η values.
- Positioned at the top of the graph, spatially grounded in the upper-middle region.
2. **δ = 0.477 (Red Line)**:
- Constant at ~6 dB across all η values.
- Positioned midway between δ = 0.25 and δ = 0.75.
3. **δ = 0.75 (Orange Line)**:
- Constant at ~3 dB across all η values.
- Positioned near the bottom of the graph.
4. **BMVDR-N (Black Dashed Line)**:
- Starts at ~4 dB when η = 0.
- Declines linearly to ~0.5 dB at η = 1.
- Spatial grounding: Originates near δ = 0.477 and slopes downward, crossing δ = 0.75 near η = 0.75.
### Key Observations
- **Constant δ Lines**: All δ values (0.25, 0.477, 0.75) maintain fixed ΔSIR_L regardless of η, indicating no dependency on η for these parameters.
- **BMVDR-N Decline**: The BMVDR-N line shows a consistent downward trend, suggesting a negative correlation between η and ΔSIR_L for this metric.
- **Spatial Relationships**:
- δ = 0.25 (12 dB) > δ = 0.477 (6 dB) > δ = 0.75 (3 dB) > BMVDR-N (0–4 dB).
- BMVDR-N intersects δ = 0.75 at η ≈ 0.75.
### Interpretation
The graph demonstrates two distinct behaviors:
1. **δ-Dependent Stability**: Higher δ values (0.25, 0.477) maintain robust ΔSIR_L, while lower δ (0.75) results in minimal ΔSIR_L. This implies δ acts as a stabilizing factor, with diminishing returns as δ increases.
2. **BMVDR-N Trade-off**: The declining trend of BMVDR-N suggests a performance degradation as η increases. This could indicate a system limitation or optimization constraint where increasing η reduces effectiveness.
The data highlights a critical design consideration: while δ parameters ensure stable ΔSIR_L, BMVDR-N’s η-dependent decline may require mitigation strategies (e.g., adaptive η control) to maintain system performance. The absence of overlap between δ lines and BMVDR-N reinforces their distinct operational regimes.