## Line Graph: Comparison of Two Data Series
### Overview
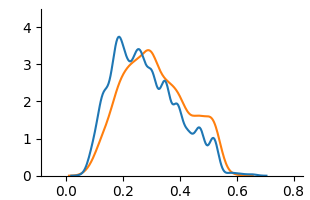
The image depicts a line graph comparing two data series (blue and orange) across an x-axis range of 0.0 to 0.8 and a y-axis range of 0 to 4. The blue line ("Series A") exhibits a sharp initial rise, peaks at ~0.25, then declines with fluctuations. The orange line ("Series B") rises more gradually, peaks later (~0.3), and declines steadily. The lines intersect near x=0.25.
### Components/Axes
- **X-axis**: Labeled with increments at 0.0, 0.2, 0.4, 0.6, 0.8 (no explicit title).
- **Y-axis**: Labeled with increments at 0, 1, 2, 3, 4 (no explicit title).
- **Legend**: Located in the top-right corner, with:
- **Blue**: "Series A"
- **Orange**: "Series B"
### Detailed Analysis
1. **Series A (Blue)**:
- **Rise**: Steep upward slope from x=0.0 to x=0.25.
- **Peak**: Reaches ~3.5 at x=0.25.
- **Decline**: Gradual drop with minor fluctuations (e.g., ~2.5 at x=0.4, ~1.2 at x=0.6, ~0.1 at x=0.8).
2. **Series B (Orange)**:
- **Rise**: Gradual upward slope from x=0.0 to x=0.3.
- **Peak**: Reaches ~3.2 at x=0.3.
- **Decline**: Steady drop (e.g., ~2.0 at x=0.4, ~1.5 at x=0.6, ~0.2 at x=0.8).
3. **Intersection**: The lines cross near x=0.25, where both series have similar y-values (~3.0).
### Key Observations
- Series A peaks earlier (x=0.25) and higher (~3.5) than Series B (x=0.3, ~3.2).
- After x=0.3, Series B declines more steadily, while Series A exhibits erratic fluctuations.
- Both series converge near x=0.8, approaching y=0.
### Interpretation
The graph suggests divergent behaviors between the two series:
- **Series A** may represent a rapid, short-lived phenomenon (e.g., a burst of activity) with post-peak instability.
- **Series B** could indicate a sustained, gradual process (e.g., a controlled release) with consistent decay.
- The intersection at x=0.25 implies a temporary equilibrium point, after which the series diverge significantly. This could reflect competing factors or thresholds in the underlying system. Without contextual labels, the exact nature of the data remains ambiguous, but the trends highlight differences in timing, magnitude, and stability.