## Chart: Binaural Interaction Response vs. Interaural Parameters
### Overview
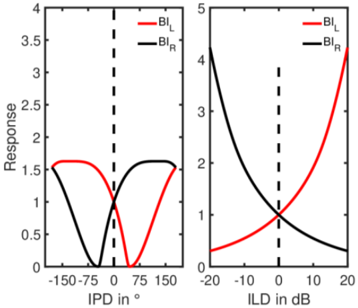
The image presents two line graphs illustrating the binaural interaction (BI) response as a function of interaural phase difference (IPD) and interaural level difference (ILD). The left graph shows the BI response for the left (BI_L) and right (BI_R) ears as a function of IPD in degrees, while the right graph shows the BI response as a function of ILD in dB.
### Components/Axes
**Left Graph:**
* **X-axis:** IPD in ° (Interaural Phase Difference in degrees). Axis markers are at -150, -75, 0, 75, and 150.
* **Y-axis:** Response. Axis markers are at 0, 0.5, 1, 1.5, 2, 2.5, 3, 3.5, and 4.
* **Legend:** Located at the top-right of the graph.
* Red line: BI_L (Binaural Interaction - Left)
* Black line: BI_R (Binaural Interaction - Right)
* A vertical dashed line is present at IPD = 0.
**Right Graph:**
* **X-axis:** ILD in dB (Interaural Level Difference in decibels). Axis markers are at -20, -10, 0, 10, and 20.
* **Y-axis:** Response. Axis markers are at 0, 1, 2, 3, 4, and 5.
* **Legend:** Located at the top-right of the graph.
* Red line: BI_L (Binaural Interaction - Left)
* Black line: BI_R (Binaural Interaction - Right)
* A vertical dashed line is present at ILD = 0.
### Detailed Analysis
**Left Graph (IPD):**
* **BI_L (Red):** The red line starts at a response of approximately 1.6 at -150°, decreases to a minimum of approximately 0 at 0°, and then increases again to approximately 1.6 at 150°.
* **BI_R (Black):** The black line starts at a response of approximately 0 at -150°, increases to a maximum of approximately 1.6 at 0°, and then decreases again to approximately 0 at 150°.
**Right Graph (ILD):**
* **BI_L (Red):** The red line starts at a response of approximately 0.3 at -20 dB, and increases exponentially to approximately 4 at 20 dB.
* **BI_R (Black):** The black line starts at a response of approximately 4.5 at -20 dB, and decreases exponentially to approximately 0.3 at 20 dB.
### Key Observations
* In the IPD graph, BI_L and BI_R are roughly mirror images of each other, with BI_L being low when BI_R is high, and vice versa.
* In the ILD graph, BI_L increases with increasing ILD, while BI_R decreases with increasing ILD.
* The dashed vertical lines in both graphs indicate the point where IPD or ILD is zero.
### Interpretation
The graphs illustrate how the binaural interaction response changes with variations in interaural phase and level differences. The IPD graph suggests that the left and right ears have opposing responses to phase differences, with one ear being more sensitive to certain phase angles while the other is less sensitive. The ILD graph indicates that the left ear's response increases with increasing level differences (i.e., when the sound is louder in the left ear), while the right ear's response decreases. This is consistent with the idea that the brain uses interaural level differences to localize sound sources. The data suggests a push-pull mechanism where one ear's response increases while the other decreases, allowing for precise sound localization.