## Charts: Binaural Response Curves
### Overview
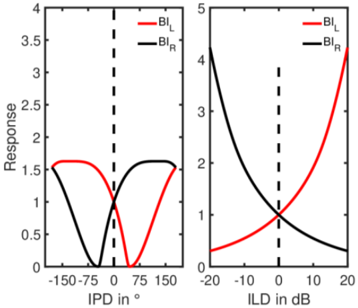
The image presents two separate charts displaying response curves for binaural cues: Interaural Phase Difference (IPD) and Interaural Level Difference (ILD). Both charts share a common legend indicating two data series: BI<sub>L</sub> (red line) and BI<sub>R</sub> (black line). The charts aim to illustrate how the brain processes spatial audio information based on these cues.
### Components/Axes
**Chart 1 (IPD):**
* **X-axis:** IPD in degrees (°), ranging from approximately -160° to 160°. Marked with tick marks at -150°, -75°, 0°, 75°, and 150°.
* **Y-axis:** Response, ranging from 0 to 4. Marked with tick marks at 0, 1, 2, 3, and 4.
* **Legend:** Located in the top-right corner.
* BI<sub>L</sub> (Red line)
* BI<sub>R</sub> (Black line)
* **Vertical dashed line:** Present at x = 0°.
**Chart 2 (ILD):**
* **X-axis:** ILD in dB, ranging from approximately -20 dB to 20 dB. Marked with tick marks at -20, -10, 0, 10, and 20.
* **Y-axis:** Response, ranging from 0 to 5. Marked with tick marks at 0, 1, 2, 3, 4, and 5.
* **Legend:** Located in the top-right corner.
* BI<sub>L</sub> (Red line)
* BI<sub>R</sub> (Black line)
* **Vertical dashed line:** Present at x = 0°.
### Detailed Analysis or Content Details
**Chart 1 (IPD):**
* **BI<sub>L</sub> (Red Line):** The curve starts at approximately 1.6 at -160°, decreases to a minimum of approximately 0.2 at -80°, increases to a maximum of approximately 1.7 at 80°, and then decreases to approximately 0.4 at 160°. The curve is roughly symmetrical around the y-axis.
* **BI<sub>R</sub> (Black Line):** The curve starts at approximately 0.1 at -160°, increases to a maximum of approximately 1.6 at -40°, decreases to a minimum of approximately 0 at 40°, and then increases to approximately 1.5 at 160°. The curve is not symmetrical.
**Chart 2 (ILD):**
* **BI<sub>L</sub> (Red Line):** The curve starts at approximately 4.2 at -20 dB, decreases monotonically to approximately 0.3 at 20 dB. The curve appears to be exponential in nature.
* **BI<sub>R</sub> (Black Line):** The curve starts at approximately 0.2 at -20 dB, increases to a maximum of approximately 1.5 at 0 dB, and then decreases to approximately 0.5 at 20 dB. The curve is roughly symmetrical around the y-axis.
### Key Observations
* In the IPD chart, the BI<sub>L</sub> curve exhibits a broader peak and a more symmetrical shape compared to the BI<sub>R</sub> curve.
* In the ILD chart, the BI<sub>L</sub> curve shows a strong negative correlation between ILD and response, while the BI<sub>R</sub> curve shows a peak response at 0 dB ILD.
* Both charts have a vertical dashed line at x=0, potentially indicating a reference point or the point of binaural symmetry.
### Interpretation
These charts likely represent the response of neurons or auditory pathways to different interaural cues. The IPD chart demonstrates how the brain encodes sound source location based on the difference in arrival time of sound at each ear. The ILD chart shows how the brain uses differences in sound intensity to localize sounds.
The differing shapes of the curves for BI<sub>L</sub> and BI<sub>R</sub> suggest that the left and right ears may have different sensitivities or processing mechanisms for these cues. The exponential decay of the BI<sub>L</sub> curve in the ILD chart indicates that even small differences in ILD can significantly affect the perceived location of a sound.
The vertical dashed line at 0°/0 dB likely represents the midline or a reference point for sound localization. Sounds originating directly in front of the listener would have an IPD and ILD close to zero. The charts provide insights into the neural mechanisms underlying spatial hearing and how the brain constructs a three-dimensional auditory scene.