## Line Graphs: Bilateral Response vs. IPD and ILD
### Overview
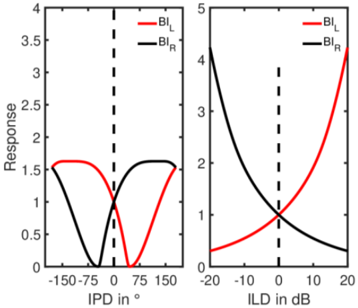
The image contains two line graphs comparing bilateral response metrics (BI_L and BI_R) across two variables: Interaural Phase Difference (IPD) in degrees (left graph) and Interaural Level Difference (ILD) in decibels (right graph). Both graphs feature vertical dashed lines at 0 on their respective axes, serving as reference points.
---
### Components/Axes
#### Left Graph (IPD in °)
- **X-axis**: IPD in degrees, ranging from -150° to 150° in 50° increments.
- **Y-axis**: Response (unitless), ranging from 0 to 4.
- **Legend**:
- Red line: BI_L (left ear response)
- Black line: BI_R (right ear response)
- **Dashed Line**: Vertical reference at IPD = 0°.
#### Right Graph (ILD in dB)
- **X-axis**: ILD in decibels, ranging from -20 dB to 20 dB in 10 dB increments.
- **Y-axis**: Response (unitless), ranging from 0 to 5.
- **Legend**:
- Red line: BI_L (left ear response)
- Black line: BI_R (right ear response)
- **Dashed Line**: Vertical reference at ILD = 0 dB.
---
### Detailed Analysis
#### Left Graph (IPD)
1. **BI_L (Red Line)**:
- Starts at ~1.5 at -150°, dips to 0 at -75°, rises to ~1.5 at 0°, dips to 0 at 75°, and rises to ~1.5 at 150°.
- Symmetric V-shaped pattern with minima at ±75°.
2. **BI_R (Black Line)**:
- Starts at 0 at -150°, rises to ~1.5 at -75°, dips to 0 at 0°, rises to ~1.5 at 75°, and returns to 0 at 150°.
- Symmetric inverted V-shaped pattern with maxima at ±75°.
#### Right Graph (ILD)
1. **BI_L (Red Line)**:
- Starts at ~4 at -20 dB, decreases to ~1 at 0 dB, then increases to ~5 at 20 dB.
- U-shaped curve with a minimum at ILD = 0 dB.
2. **BI_R (Black Line)**:
- Starts at ~1 at -20 dB, increases to ~5 at 0 dB, then decreases to ~1 at 20 dB.
- Inverted U-shaped curve with a maximum at ILD = 0 dB.
---
### Key Observations
1. **Symmetry in IPD Response**:
- Both BI_L and BI_R exhibit symmetry around IPD = 0°, but with opposing trends (BI_L has minima at ±75°, BI_R has maxima at ±75°).
2. **Inverse Relationship in ILD Response**:
- BI_L and BI_R show opposing trends across ILD: BI_L decreases then increases, while BI_R increases then decreases, crossing at ILD = 0 dB.
3. **Dashed Line Significance**:
- The vertical dashed lines at 0° (IPD) and 0 dB (ILD) likely represent neutral or baseline conditions where responses are balanced or neutral.
---
### Interpretation
- **Bilateral Response Dynamics**:
- The left graph suggests that bilateral responses (BI_L and BI_R) are inversely correlated with IPD. For example, BI_L is minimized at ±75° IPD, while BI_R is maximized at those points, indicating potential phase-dependent asymmetry in auditory or sensory processing.
- **ILD-Dependent Asymmetry**:
- The right graph reveals that ILD modulates responses in opposing directions for BI_L and BI_R. At ILD = 0 dB, BI_L is minimized (~1) and BI_R is maximized (~5), suggesting that level differences between ears drive divergent bilateral responses.
- **Practical Implications**:
- These patterns could reflect mechanisms in auditory localization, where phase and level differences between ears are critical for spatial perception. The dashed lines at 0°/0 dB may represent reference points for balanced conditions, while deviations (e.g., ±75° IPD or ±20 dB ILD) highlight asymmetric processing.
- **Notable Anomalies**:
- The sharp minima/maxima at ±75° IPD and 0 dB ILD suggest threshold-like behaviors, potentially indicating critical points in system response or perceptual thresholds.