## Bar Chart: Naming Variation by Concept (Inconsistency Measure)
### Overview
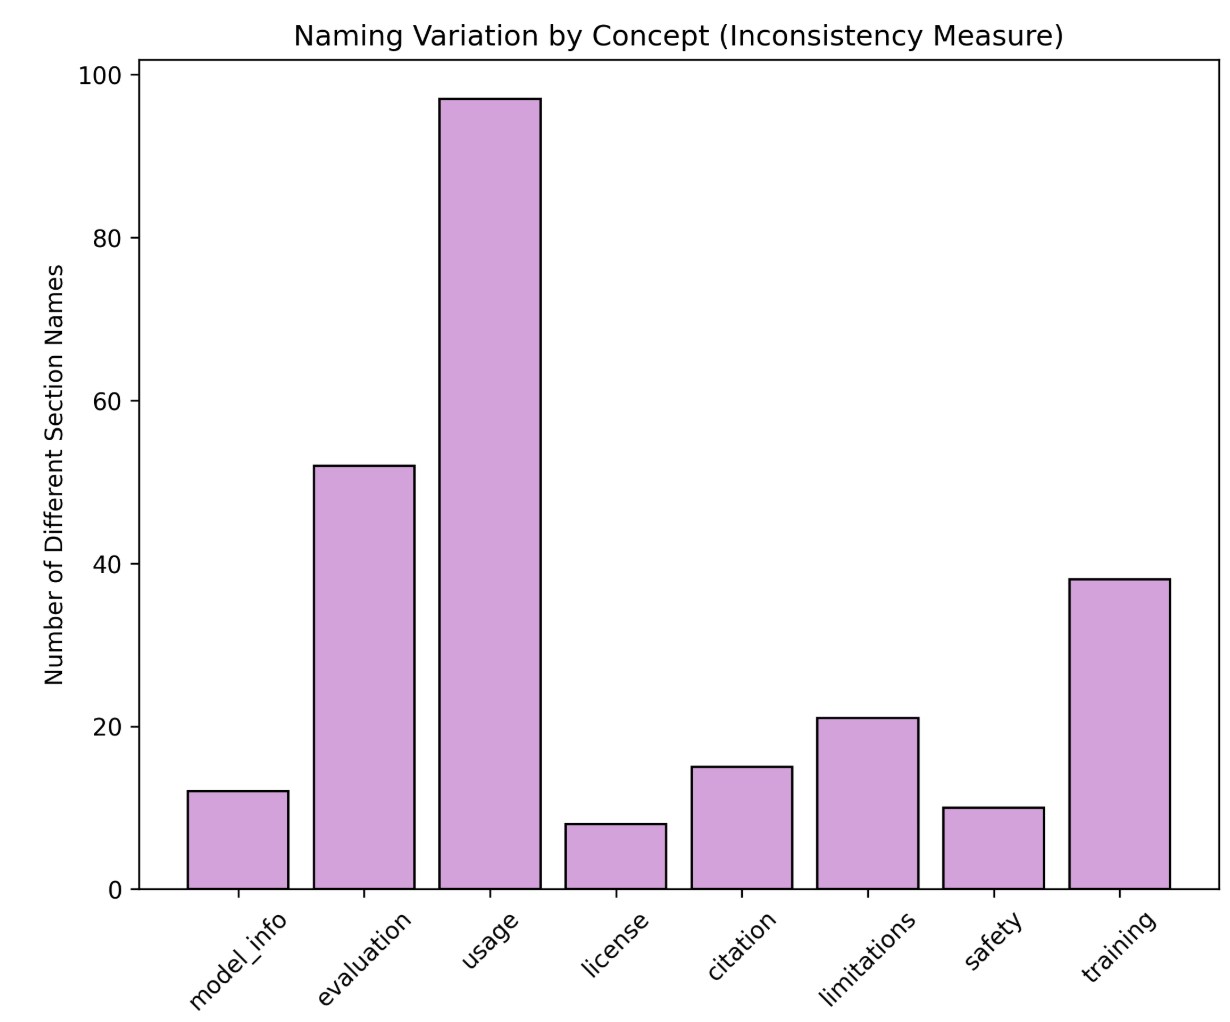
The image is a bar chart illustrating the naming variation by concept, which serves as an inconsistency measure. The chart displays the number of different section names for various concepts, providing a visual representation of how consistently each concept is named across different sections.
### Components/Axes
* **Title:** Naming Variation by Concept (Inconsistency Measure)
* **X-axis:** Concepts (model\_info, evaluation, usage, license, citation, limitations, safety, training)
* **Y-axis:** Number of Different Section Names (scale from 0 to 100)
### Detailed Analysis
The bar chart presents the following data for each concept:
* **model\_info:** Approximately 12
* **evaluation:** Approximately 52
* **usage:** Approximately 97
* **license:** Approximately 8
* **citation:** Approximately 15
* **limitations:** Approximately 21
* **safety:** Approximately 10
* **training:** Approximately 38
### Key Observations
* The "usage" concept has the highest number of different section names, indicating the greatest inconsistency in naming.
* "license" and "safety" have the lowest number of different section names, suggesting higher consistency.
* There is a significant difference in naming variation between "usage" and other concepts.
### Interpretation
The chart suggests that the "usage" concept is named inconsistently across different sections, which could lead to confusion or difficulty in locating relevant information. Conversely, "license" and "safety" are named more consistently. This information can be used to improve the standardization of section names, particularly for concepts with high naming variation. The data highlights areas where documentation or naming conventions may need to be clarified or enforced to ensure consistency.