# Technical Document Extraction: Prediction Relative Error Analysis
## Chart Description
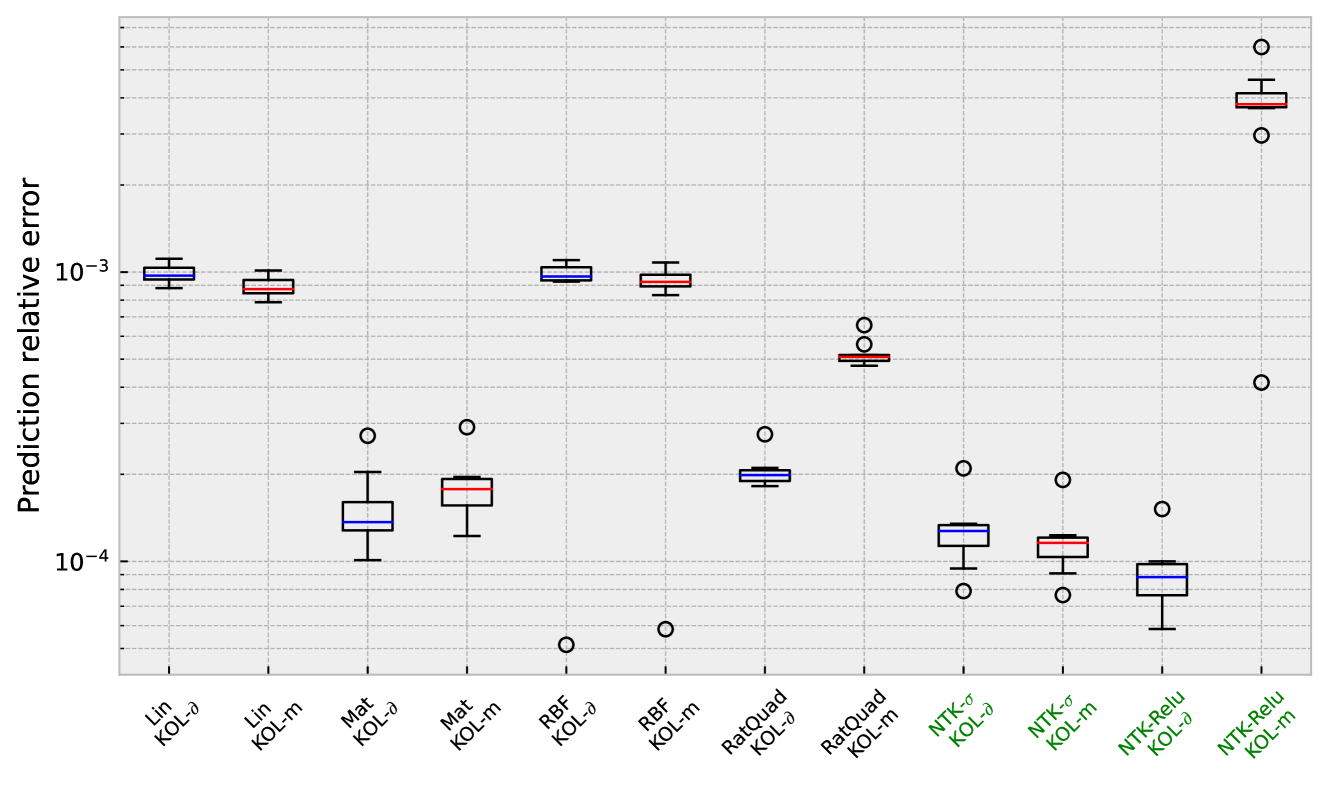
The image is a **box plot chart** comparing **prediction relative errors** across multiple models. The y-axis uses a **logarithmic scale** (10⁻⁴ to 10⁻³), while the x-axis categorizes models by type and configuration.
---
### **Key Components**
1. **X-Axis Labels** (Model Configurations):
- **Lin-KOL-δ**, **Lin-KOL-m**
- **Mat-KOL-δ**, **Mat-KOL-m**
- **RBF-KOL-δ**, **RBF-KOL-m**
- **RatQuad-KOL-δ**, **RatQuad-KOL-m**
- **NTK-Relu-KOL-δ**, **NTK-Relu-KOL-m**
2. **Y-Axis Title**:
`Prediction relative error` (log scale: 10⁻⁴ to 10⁻³)
3. **Legend**:
- **Blue**: `Prediction error`
- **Red**: `Ground truth error`
4. **Title**:
`Prediction relative error for different models`
---
### **Data Categories & Sub-Categories**
- **Model Types**:
- **Lin** (Linear)
- **Mat** (Matrix-based)
- **RBF** (Radial Basis Function)
- **RatQuad** (Rational Quadratic)
- **NTK-Relu** (Neural Tangent Kernel with ReLU)
- **Configuration Sub-Categories**:
- **δ (Delta)**: Likely represents a specific parameter or variant.
- **m (Mean)**: Likely represents an averaged or baseline variant.
---
### **Key Trends & Observations**
1. **Prediction vs. Ground Truth Errors**:
- **Blue boxes** (prediction error) consistently show **lower median values** than **red boxes** (ground truth error) across all models.
- Example: `Lin-KOL-δ` and `RBF-KOL-m` have the smallest prediction errors (~10⁻³), while `NTK-Relu-KOL-m` exhibits the largest (~10⁻²).
2. **Outliers**:
- Outliers (open circles) are present for several models, e.g., `Mat-KOL-δ` and `NTK-Relu-KOL-m`, indicating occasional high-error predictions.
3. **Model Performance**:
- **NTK-Relu** models generally have higher errors compared to **Lin** and **RBF** models.
- **RatQuad-KOL-m** shows moderate prediction errors (~10⁻³ to 10⁻²).
---
### **Cross-Referenced Legend & Data**
- **Blue (Prediction Error)**:
- Aligns with the lower median values in all box plots.
- **Red (Ground Truth Error)**:
- Corresponds to higher median values, reflecting the true error distribution.
---
### **Summary**
The chart demonstrates that **prediction errors** (blue) are systematically lower than **ground truth errors** (red) across all models. Performance varies by model type, with **NTK-Relu** configurations showing the poorest prediction accuracy. Outliers suggest variability in specific cases.