## Line Chart: Convergence of HMC Steps Across Different 'd' Values
### Overview
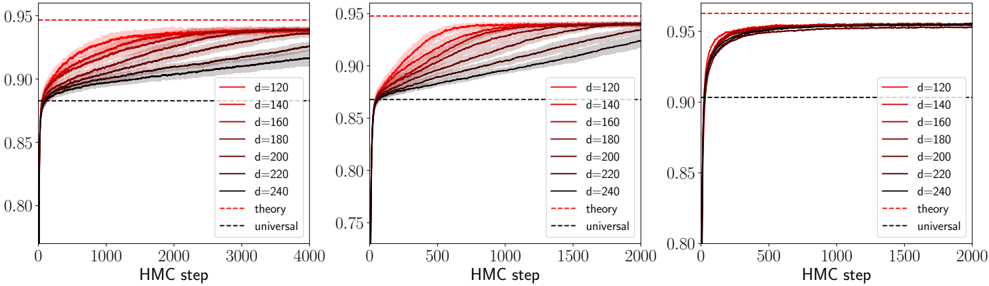
The image displays three panels of line charts, each illustrating the convergence of HMC (Hamiltonian Monte Carlo) steps across varying 'd' values (120, 140, 160, 180, 200, 220, 240). The y-axis represents a probability scale (0.75–0.95), while the x-axis tracks HMC steps (0–4000). Each panel includes a legend with color-coded lines for 'd' values and two dashed reference lines labeled "theory" (red, ~0.95) and "universal" (black, ~0.90). The charts show how different 'd' values influence the convergence trajectory toward these reference lines.
---
### Components/Axes
- **X-axis (HMC step)**: Labeled "HMC step" with ticks at 0, 1000, 2000, 3000, 4000 (left and middle panels) and 0, 500, 1000, 1500, 2000 (right panel).
- **Y-axis (Probability)**: Labeled with a scale from 0.75 to 0.95.
- **Legend**: Positioned on the right side of each panel.
- Solid lines:
- Red: d=120
- Dark red: d=140
- Maroon: d=160
- Brown: d=180
- Dark brown: d=200
- Black: d=220
- Gray: d=240
- Dashed lines:
- Red: "theory" (~0.95)
- Black: "universal" (~0.90)
---
### Detailed Analysis
#### Panel 1 (Left)
- **Lines**:
- All lines start near 0.8 at HMC step 0.
- Lines for higher 'd' values (e.g., d=240) rise more steeply and approach the "theory" line (~0.95) by ~3000 steps.
- Lower 'd' values (e.g., d=120) converge toward the "universal" line (~0.90) by ~4000 steps.
- **Trends**:
- Lines for d=120–240 show gradual upward slopes, with higher 'd' values achieving higher probabilities faster.
- The "theory" line (red dashed) remains constant at ~0.95, while the "universal" line (black dashed) stays at ~0.90.
#### Panel 2 (Middle)
- **Lines**:
- Similar to Panel 1 but with a narrower x-axis range (0–2000).
- Lines for d=120–240 show similar convergence patterns, with d=240 approaching the "theory" line more closely.
- **Trends**:
- Lines for d=120–240 exhibit consistent upward trajectories, with d=240 reaching ~0.94 by 2000 steps.
- The "universal" line (~0.90) acts as a lower bound for all 'd' values.
#### Panel 3 (Right)
- **Lines**:
- X-axis range is 0–2000, with a focus on earlier HMC steps.
- Lines for d=120–240 show rapid convergence toward the "theory" line (~0.95) by ~1000 steps.
- Lower 'd' values (e.g., d=120) approach the "universal" line (~0.90) by ~2000 steps.
- **Trends**:
- Lines for d=120–240 demonstrate steep initial increases, with d=240 reaching ~0.95 by 1000 steps.
- The "theory" line remains the upper bound, while the "universal" line serves as a lower reference.
---
### Key Observations
1. **Convergence Patterns**:
- Higher 'd' values (e.g., d=240) converge faster toward the "theory" line (~0.95), suggesting improved performance with larger 'd'.
- Lower 'd' values (e.g., d=120) approach the "universal" line (~0.90), indicating a baseline or standard performance.
2. **Dashed Lines**:
- The "theory" line (red dashed) represents an idealized upper limit, while the "universal" line (black dashed) acts as a lower reference.
3. **Consistency Across Panels**:
- All panels show similar trends, with the right panel emphasizing early convergence (0–2000 steps).
---
### Interpretation
The data suggests that increasing the 'd' value (possibly representing model complexity or parameter count) enhances the convergence rate of HMC steps toward the theoretical upper bound ("theory" line). This implies that higher 'd' values may lead to more efficient sampling or better model performance. The "universal" line (~0.90) could represent a baseline or a standard for comparison. The consistent trends across panels highlight the robustness of the convergence behavior, with higher 'd' values achieving closer alignment with the theoretical limit. No outliers or anomalies are observed, reinforcing the reliability of the patterns.