## Technical Diagram: Knowledge Distillation (KD) Process Comparison
### Overview
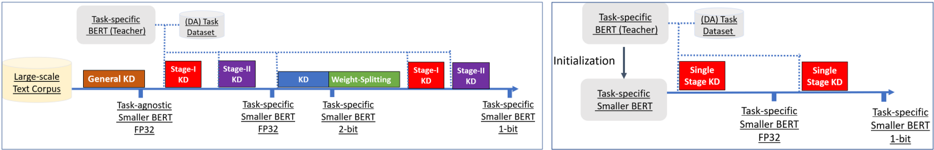
The image displays two side-by-side flow diagrams illustrating different strategies for Knowledge Distillation (KD) applied to BERT models. The left diagram depicts a **multi-stage, progressive distillation** pipeline, while the right diagram shows a **simplified, single-stage** approach. Both diagrams trace the transformation of a model from a large teacher to a smaller, quantized student using a large-scale text corpus and a task-specific dataset.
### Components/Axes
The diagrams are structured as horizontal process flows with labeled boxes and directional arrows. Key components include:
**Common Elements (Both Diagrams):**
* **Input Data Sources:**
* `Large-scale Text Corpus` (Yellow box, far left)
* `(DA) Task Dataset` (Light blue box, top center)
* **Teacher Model:**
* `Task-specific BERT (Teacher)` (Grey box, top left)
* **Student Model Progression:** Represented by a horizontal blue arrow timeline, with model states indicated below it.
* **Color-Coded Legend (Bottom of each diagram):**
* **Orange:** `Task-agnostic Smaller BERT FP32`
* **Purple:** `Task-specific Smaller BERT FP32`
* **Blue:** `Task-specific Smaller BERT 2-bit`
* **Red:** `Task-specific Smaller BERT 1-bit`
**Left Diagram - Multi-Stage Pipeline:**
* **Process Stages (Boxes on the timeline):**
1. `General KD` (Orange box)
2. `Stage-I KD` (Purple box)
3. `Stage-II KD` (Purple box)
4. `KD` (Blue box)
5. `Weight-Splitting` (Green box)
6. `Stage-I KD` (Red box)
7. `Stage-II KD` (Red box)
* **Model States (Below the timeline):**
* Initial: `Task-agnostic Smaller BERT FP32` (Orange text)
* After Stage-I/II KD: `Task-specific Smaller BERT FP32` (Purple text)
* After Weight-Splitting: `Task-specific Smaller BERT 2-bit` (Blue text)
* Final: `Task-specific Smaller BERT 1-bit` (Red text)
**Right Diagram - Single-Stage Pipeline:**
* **Process Step:**
* `Initialization` (Arrow from Teacher to Student)
* `Single Stage KD` (Red box, appears twice sequentially)
* **Model States:**
* Initial (after Initialization): `Task-specific Smaller BERT FP32` (Purple text)
* Final (after two Single Stage KD steps): `Task-specific Smaller BERT 1-bit` (Red text)
### Detailed Analysis
**Left Diagram (Multi-Stage) Flow:**
1. A `Task-specific BERT (Teacher)` and a `Large-scale Text Corpus` feed into a `General KD` stage, producing a `Task-agnostic Smaller BERT FP32`.
2. This model undergoes two sequential `Stage-I KD` and `Stage-II KD` steps, using the `(DA) Task Dataset`, to become a `Task-specific Smaller BERT FP32`.
3. A `Weight-Splitting` operation (green box) converts the FP32 model into a `Task-specific Smaller BERT 2-bit` model.
4. This 2-bit model then goes through another two-stage distillation (`Stage-I KD` and `Stage-II KD`), again using the task dataset, to produce the final `Task-specific Smaller BERT 1-bit` model.
**Right Diagram (Single-Stage) Flow:**
1. The `Task-specific BERT (Teacher)` is used for `Initialization` of a `Task-specific Smaller BERT FP32` model.
2. This FP32 model is directly distilled via a `Single Stage KD` process (using the task dataset) into a `Task-specific Smaller BERT 1-bit` model.
3. The diagram shows a second `Single Stage KD` box, suggesting either an iterative refinement or a representation of the same process applied to achieve the final 1-bit model.
### Key Observations
1. **Complexity vs. Simplicity:** The left diagram outlines a complex, 7-step pipeline involving intermediate model states (FP32, 2-bit) and specialized operations like "Weight-Splitting." The right diagram proposes a much simpler 2-step process (Initialization + Single Stage KD) to reach the same final model format (1-bit).
2. **Task Specificity:** The multi-stage approach starts with a *task-agnostic* model and gradually specializes it. The single-stage approach begins with a *task-specific* model from the outset.
3. **Quantization Path:** The multi-stage path explicitly includes a 2-bit intermediate model, while the single-stage path appears to quantize directly from FP32 to 1-bit.
4. **Data Usage:** Both methods utilize the `(DA) Task Dataset` for the task-specific distillation stages. The multi-stage method also uses the `Large-scale Text Corpus` for the initial General KD.
### Interpretation
These diagrams contrast two philosophies for creating efficient, quantized BERT models:
* **The Multi-Stage Strategy (Left)** represents a **gradual, controlled compression**. It prioritizes stability by first creating a strong task-agnostic student, then specializing it, then compressing it in measured steps (FP32 -> 2-bit -> 1-bit) with distillation at each phase. This likely aims to preserve performance by minimizing the "shock" of compression, but at the cost of significant computational overhead and pipeline complexity.
* **The Single-Stage Strategy (Right)** represents an **aggressive, end-to-end compression**. It bets on the ability of a single, well-initialized distillation step to directly transfer knowledge from the large teacher to the highly quantized (1-bit) student. This is far more efficient and simpler to implement but carries a higher risk of performance degradation, as the student must learn task specifics and extreme quantization simultaneously.
The core investigative question posed by this comparison is: **Is the elaborate, multi-stage process necessary to maintain model performance when creating a 1-bit BERT, or can a smarter single-stage distillation achieve comparable results with much greater efficiency?** The diagrams set up an experiment to test the trade-off between process complexity and final model efficacy.