\n
## Diagram: Shape Hierarchy
### Overview
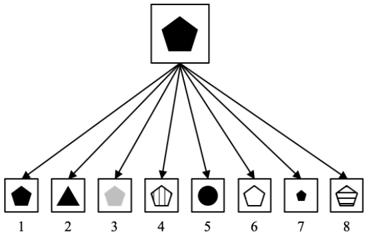
The image depicts a hierarchical diagram showing a central pentagon shape branching out to eight different shapes below. Lines connect the central shape to each of the lower shapes, suggesting a parent-child relationship or a categorization scheme. Each lower shape is numbered from 1 to 8.
### Components/Axes
The diagram consists of:
* **Central Shape:** A filled black pentagon.
* **Child Shapes:** Eight distinct shapes, each with a unique form and fill color.
* **Connecting Lines:** Eight lines radiating from the central pentagon to each child shape.
* **Labels:** Numbers 1 through 8 positioned below each child shape.
### Detailed Analysis or Content Details
The shapes and their corresponding labels are as follows:
1. A filled black hexagon.
2. A filled black triangle.
3. A light gray filled square.
4. A white shape with a black outline resembling a flower or a stylized cup.
5. A filled black circle.
6. A white shape with a black outline resembling a pentagon.
7. A filled black diamond.
8. A white shape with a black outline resembling a basket or a hat.
The central pentagon is positioned at the top-center of the image. The eight child shapes are arranged horizontally in a row below the central shape. The lines connecting the central shape to the child shapes originate from the center of the pentagon and extend downwards to the center of each respective child shape.
### Key Observations
The diagram presents a clear hierarchical structure. The central pentagon appears to be the parent category, and the eight shapes below represent subcategories or instances. The shapes vary in their fill color (black, gray, white) and outline (present or absent). The shapes are all geometric.
### Interpretation
The diagram likely illustrates a classification or categorization system. The central pentagon could represent a broader concept, while the eight shapes represent specific examples or types within that concept. The use of different shapes and fill colors might indicate different attributes or characteristics of each subcategory. Without additional context, the specific meaning of the shapes and their relationship to the central pentagon remains ambiguous. It could be a visual representation of a taxonomy, a decision tree, or a simple organizational chart. The diagram is a visual aid for understanding relationships between different elements, but it lacks quantitative data or specific labels beyond the numerical identifiers.