## Diagram: Hierarchical Shape Classification
### Overview
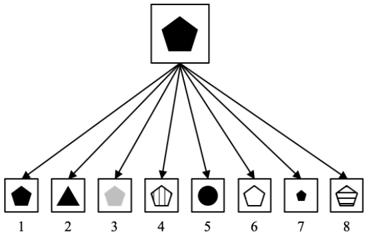
The image displays a black-and-white hierarchical diagram. A single, large, solid black pentagon within a square frame at the top serves as the root or parent category. Eight arrows radiate downward from this central figure, each pointing to a smaller, numbered square frame containing a distinct geometric shape. The diagram appears to illustrate a classification system or a set of variations derived from a primary shape.
### Components/Axes
* **Root Element (Top-Center):** A large square frame containing a solid black, regular pentagon.
* **Arrows:** Eight straight lines with arrowheads, originating from the bottom edge of the root square and terminating at the top edge of each of the eight child squares.
* **Child Elements (Bottom Row):** Eight smaller, equally sized square frames arranged in a horizontal row. Each is labeled with a number (1-8) directly below it.
* **Labels:** The numbers "1" through "8" are the only textual elements, positioned centrally beneath their respective squares.
### Detailed Analysis
The diagram consists of one parent and eight child components. Below is a precise description of each numbered element, from left to right:
1. **Square 1:** Contains a solid black pentagon, identical in shape and fill to the root element but smaller.
2. **Square 2:** Contains a solid black triangle (equilateral, pointing upward).
3. **Square 3:** Contains a solid gray pentagon. The fill is a uniform, medium gray tone.
4. **Square 4:** Contains a pentagon with a black outline and a white interior. Inside this pentagon is a smaller, concentric pentagon, also outlined in black.
5. **Square 5:** Contains a solid black circle.
6. **Square 6:** Contains a pentagon with a black outline and a white interior (no inner shape).
7. **Square 7:** Contains a small, solid black pentagon. It is notably smaller than the pentagon in Square 1.
8. **Square 8:** Contains a pentagon with a black outline and a white interior. The interior is filled with horizontal black lines (hatching).
### Key Observations
* **Shape Variation:** The child elements explore variations of the root pentagon (squares 1, 3, 4, 6, 7, 8) and introduce entirely different basic shapes (triangle in square 2, circle in square 5).
* **Attribute Variation:** For the pentagon-based shapes, the diagram varies:
* **Fill:** Solid black (1), solid gray (3), outline only (6), hatched (8).
* **Size:** Standard (1, 3, 4, 6, 8) vs. small (7).
* **Complexity:** Simple outline (6) vs. nested outline (4).
* **Spatial Layout:** The root is centered at the top. The eight child squares are evenly spaced in a single horizontal row at the bottom, creating a clear, fan-like hierarchical structure. The arrows provide unambiguous directional flow from parent to child.
### Interpretation
This diagram is a visual taxonomy or a feature matrix for geometric shapes, using the pentagon as the primary exemplar. It systematically deconstructs the properties of the root shape to generate a set of distinct categories.
* **What it demonstrates:** The diagram shows how a single concept (a pentagon) can be differentiated along multiple axes: **shape class** (pentagon vs. triangle vs. circle), **fill property** (solid, empty, textured), **scale**, and **structural complexity** (simple vs. nested).
* **Relationships:** The arrows explicitly denote a "is-a-type-of" or "can-vary-into" relationship. Each child is a valid instance or variation derived from the parent category. The inclusion of non-pentagon shapes (2, 5) suggests the parent category might be interpreted more broadly as "basic geometric shapes," with the pentagon being the specific starting point for this exploration.
* **Notable Pattern:** The most complex variations (nested shape in 4, hatching in 8) are placed toward the right side of the sequence, which might imply an intended progression from simple to more complex modifications, though this is not strictly linear.
* **Potential Purpose:** This could serve as an educational tool for teaching shape attributes, a design system for iconography, or a logical framework for a classification algorithm in computer vision. The lack of descriptive labels beyond numbers suggests the visual differences are meant to be self-explanatory.