## Line Chart: PPL vs Removed Block Index
### Overview
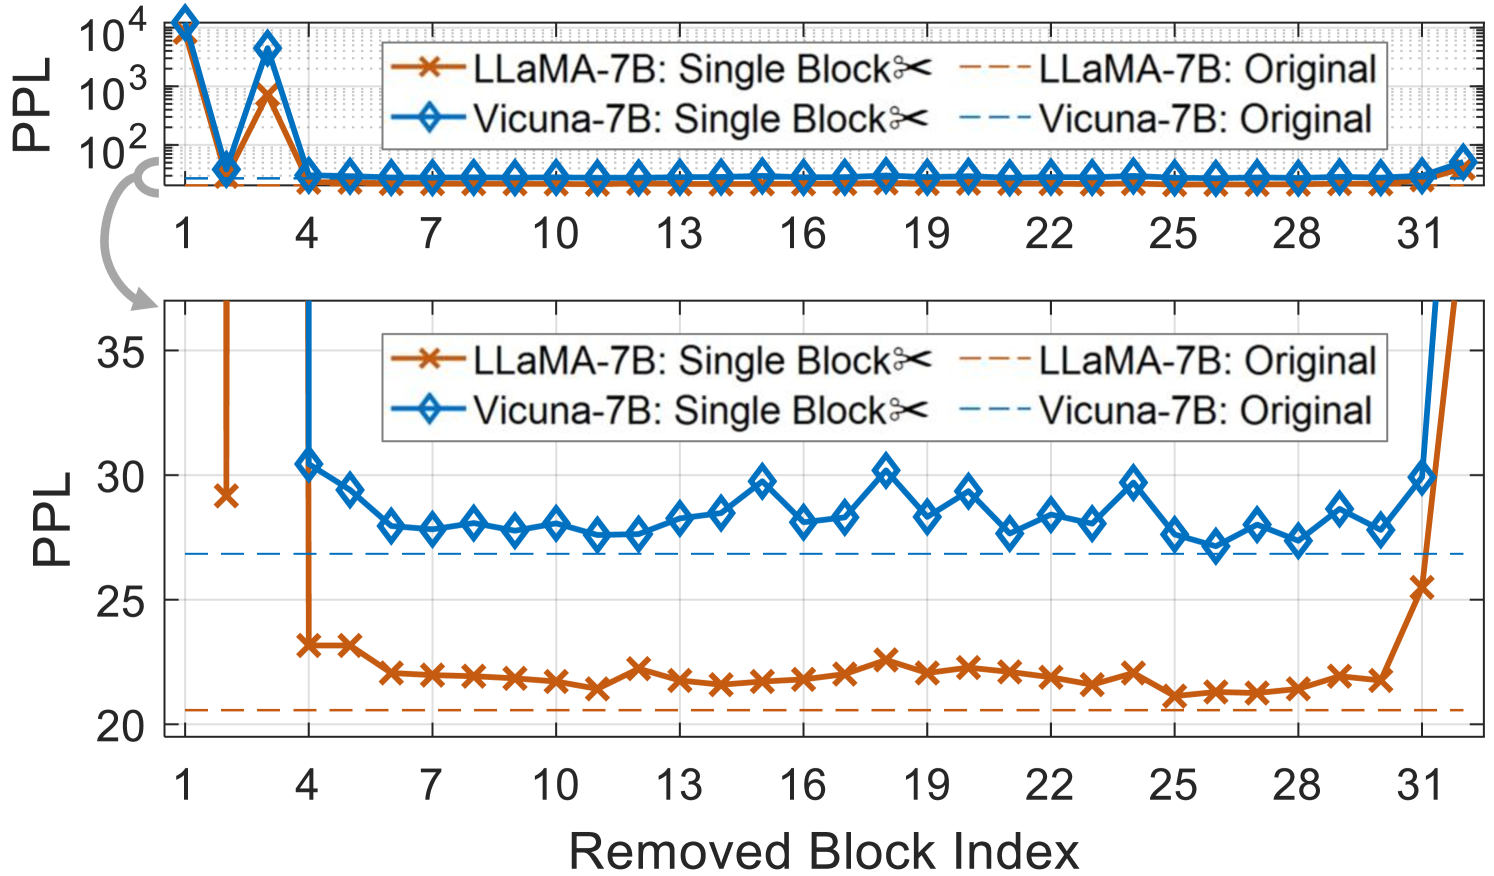
The image contains two line charts, one above the other, displaying the Perplexity (PPL) of LLaMA-7B and Vicuna-7B models as a function of the removed block index. The top chart uses a logarithmic scale for the PPL axis, while the bottom chart uses a linear scale, providing a zoomed-in view of the lower PPL values. Both charts compare the "Single Block" removal strategy against the "Original" (no removal) baseline.
### Components/Axes
**Top Chart:**
* **Y-axis (PPL):** Perplexity, logarithmic scale ranging from approximately 50 to 10,000. Axis markers are at 10^2, 10^3, and 10^4.
* **X-axis (Removed Block Index):** Integer values from 1 to 31, with markers at intervals of 3 (1, 4, 7, 10, 13, 16, 19, 22, 25, 28, 31).
* **Legend (Top-Right):**
* Brown solid line with 'x' markers: "LLaMA-7B: Single Block"
* Blue solid line with diamond markers: "Vicuna-7B: Single Block"
* Brown dashed line: "LLaMA-7B: Original"
* Blue dashed line: "Vicuna-7B: Original"
**Bottom Chart:**
* **Y-axis (PPL):** Perplexity, linear scale ranging from 20 to 35, with markers at intervals of 5 (20, 25, 30, 35).
* **X-axis (Removed Block Index):** Integer values from 1 to 31, with markers at intervals of 3 (1, 4, 7, 10, 13, 16, 19, 22, 25, 28, 31).
* **Legend (Top-Right):** Same as the top chart.
### Detailed Analysis
**Top Chart:**
* **LLaMA-7B: Single Block (Brown solid line with 'x' markers):** Starts at approximately 100, spikes to around 1000 at index 1, drops sharply to around 50 at index 4, and then remains relatively constant around 50 for the remaining indices.
* **Vicuna-7B: Single Block (Blue solid line with diamond markers):** Starts at approximately 100, spikes to around 10000 at index 1, drops sharply to around 50 at index 4, and then remains relatively constant around 50 for the remaining indices.
* **LLaMA-7B: Original (Brown dashed line):** Remains constant at approximately 50 across all indices.
* **Vicuna-7B: Original (Blue dashed line):** Remains constant at approximately 50 across all indices.
**Bottom Chart:**
* **LLaMA-7B: Single Block (Brown solid line with 'x' markers):** Starts at approximately 29 at index 1, drops to around 23 at index 4, and then fluctuates slightly between 21 and 23 for the remaining indices. It rises sharply at index 31 to approximately 38.
* **Vicuna-7B: Single Block (Blue solid line with diamond markers):** Starts at approximately 30 at index 1, drops to around 28 at index 4, and then fluctuates between 27 and 30 for the remaining indices. It rises sharply at index 31 to approximately 38.
* **LLaMA-7B: Original (Brown dashed line):** Remains constant at approximately 20.5 across all indices.
* **Vicuna-7B: Original (Blue dashed line):** Remains constant at approximately 27 across all indices.
### Key Observations
* Both "Single Block" removal strategies for LLaMA-7B and Vicuna-7B exhibit a significant spike in PPL at index 1 in the top chart, indicating a high sensitivity to the removal of the first block.
* After the initial spike, the PPL for the "Single Block" removal strategies stabilizes at a lower level, as seen in both charts.
* The "Original" baselines for both models remain constant across all indices, as expected.
* The bottom chart provides a clearer view of the PPL fluctuations for the "Single Block" removal strategies after the initial spike.
* Both "Single Block" removal strategies for LLaMA-7B and Vicuna-7B exhibit a significant spike in PPL at index 31 in the bottom chart.
### Interpretation
The data suggests that removing the first block (index 1) has a significant impact on the perplexity of both LLaMA-7B and Vicuna-7B models. This indicates that the first block likely contains critical information for the models' performance. After the initial impact, the models seem to adapt to the removal of subsequent blocks, resulting in a relatively stable PPL. The "Original" baselines serve as a control, demonstrating the expected PPL when no blocks are removed. The spike at index 31 suggests that the last block is also important. The fluctuations in PPL for the "Single Block" removal strategies after the initial spike could be attributed to the varying importance of different blocks within the models.