\n
## Line Chart: Perplexity (PPL) vs. Removed Block Index
### Overview
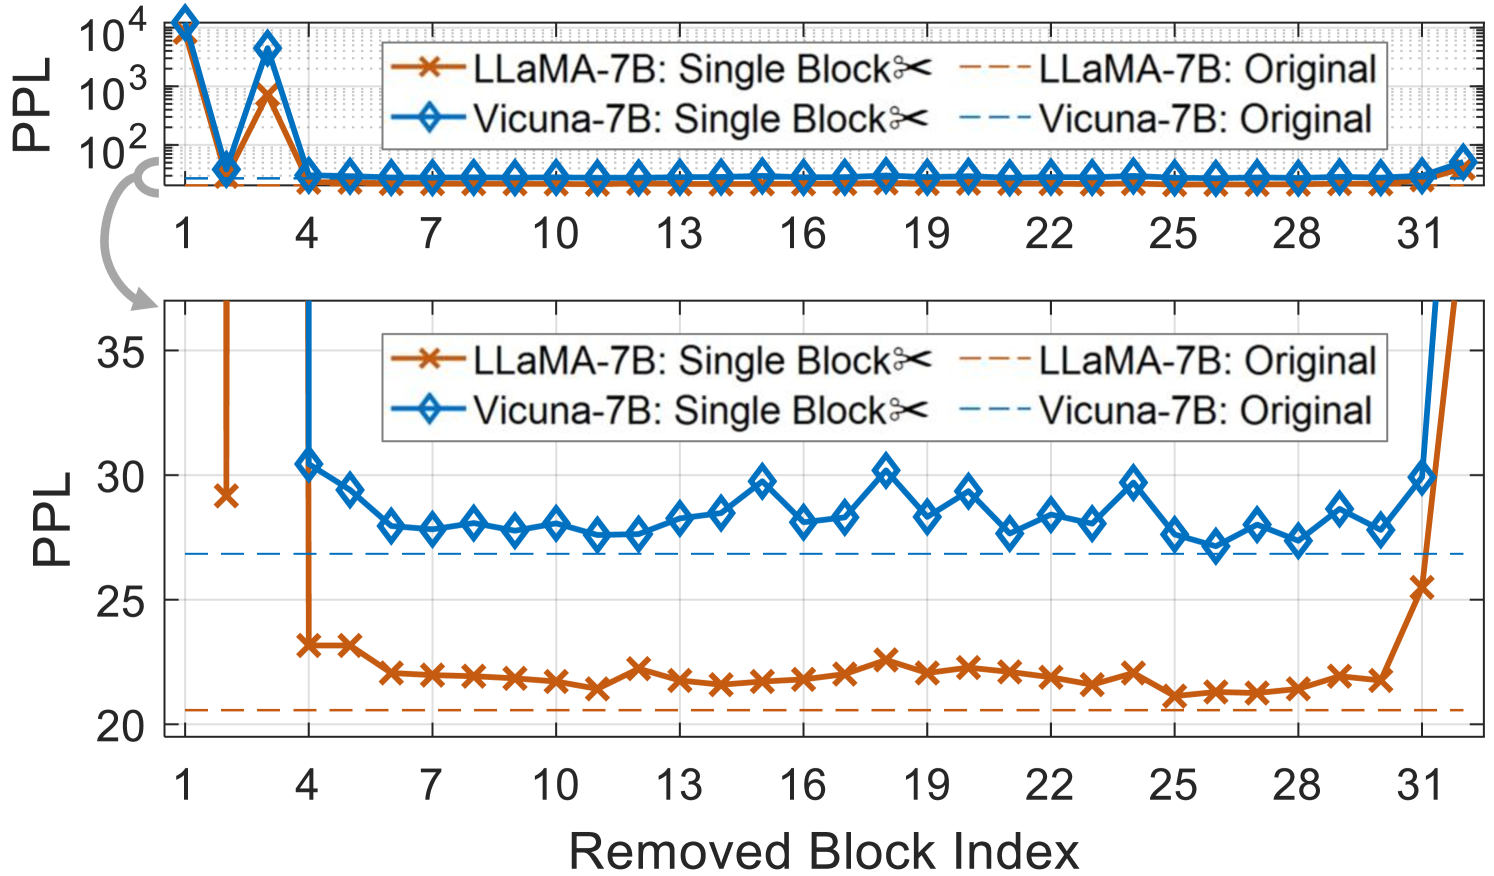
The image presents two line charts displaying Perplexity (PPL) as a function of the Removed Block Index. Each chart shows two data series for both LLaMA-7B and Vicuna-7B models, comparing the "Single Block" removal scenario to the "Original" model performance. The top chart uses a logarithmic y-axis to visualize the initial high PPL values, while the bottom chart uses a linear y-axis to show the more detailed PPL changes after the initial drop.
### Components/Axes
* **X-axis:** Removed Block Index, ranging from 1 to 31.
* **Y-axis (Top Chart):** Perplexity (PPL), on a logarithmic scale from 10^2 to 10^4.
* **Y-axis (Bottom Chart):** Perplexity (PPL), on a linear scale from 20 to 35.
* **Legend (Top-Left):**
* LLaMA-7B: Single Block (Orange, marked with 'x')
* Vicuna-7B: Single Block (Blue, marked with diamond)
* LLaMA-7B: Original (Orange, dashed line)
* Vicuna-7B: Original (Blue, dashed line)
* **Gridlines:** Present on both charts, aiding in value estimation.
### Detailed Analysis or Content Details
**Top Chart (Logarithmic Scale):**
* **Vicuna-7B: Single Block:** Starts at approximately 10^3.5 PPL (around 3162) at index 1, rapidly decreases to approximately 10^2 PPL (around 100) by index 4, and then fluctuates between approximately 80 and 150 PPL for indices 7 through 28. It then increases to approximately 250 PPL at index 31.
* **LLaMA-7B: Single Block:** Starts at approximately 10^3 PPL (around 1000) at index 1, decreases to approximately 10^2 PPL (around 100) by index 4, and then fluctuates between approximately 50 and 100 PPL for indices 7 through 28. It then increases to approximately 150 PPL at index 31.
* **Vicuna-7B: Original:** Remains relatively stable around 100 PPL throughout all indices, with minor fluctuations.
* **LLaMA-7B: Original:** Remains relatively stable around 70 PPL throughout all indices, with minor fluctuations.
**Bottom Chart (Linear Scale):**
* **Vicuna-7B: Single Block:** Starts at approximately 31 PPL at index 1, drops to approximately 27 PPL at index 4, and then fluctuates between approximately 24 and 30 PPL for indices 7 through 28. It then increases to approximately 33 PPL at index 31.
* **LLaMA-7B: Single Block:** Starts at approximately 24 PPL at index 1, drops to approximately 22 PPL at index 4, and then fluctuates between approximately 21 and 26 PPL for indices 7 through 28. It then increases to approximately 24 PPL at index 31.
* **Vicuna-7B: Original:** Remains relatively stable around 22 PPL throughout all indices, with minor fluctuations.
* **LLaMA-7B: Original:** Remains relatively stable around 21 PPL throughout all indices, with minor fluctuations.
### Key Observations
* Both models (LLaMA-7B and Vicuna-7B) exhibit a significant drop in PPL when a single block is removed, particularly in the initial stages (indices 1-4).
* After the initial drop, the PPL for both models with single block removal fluctuates but remains relatively stable.
* The "Original" models (without block removal) maintain consistently lower PPL values compared to the "Single Block" removal scenarios.
* Vicuna-7B generally has a higher PPL than LLaMA-7B, both in the "Single Block" and "Original" scenarios.
* Both "Single Block" lines show a slight increase in PPL towards the end of the index range (around index 31).
### Interpretation
The data suggests that removing a single block of information from the models significantly impacts their perplexity, indicating a loss of predictive power. The initial sharp decrease in PPL likely represents the model adjusting to the missing information. The subsequent stabilization suggests the model is able to partially compensate for the removal. The consistently lower PPL of the "Original" models confirms that the complete model performs better than the model with a block removed.
The difference in PPL between Vicuna-7B and LLaMA-7B suggests that LLaMA-7B is more robust to block removal or inherently has a better predictive capability. The slight increase in PPL at the end of the index range for the "Single Block" scenarios could indicate that removing blocks cumulatively degrades performance, or that the later blocks contain more critical information.
The use of a logarithmic scale in the top chart is crucial for visualizing the large initial PPL values, while the linear scale in the bottom chart provides a more detailed view of the fluctuations after the initial drop. This combined approach allows for a comprehensive understanding of the impact of block removal on model perplexity.