## [Chart Type]: Two-Panel Line Chart (Perplexity vs. Removed Block Index)
### Overview
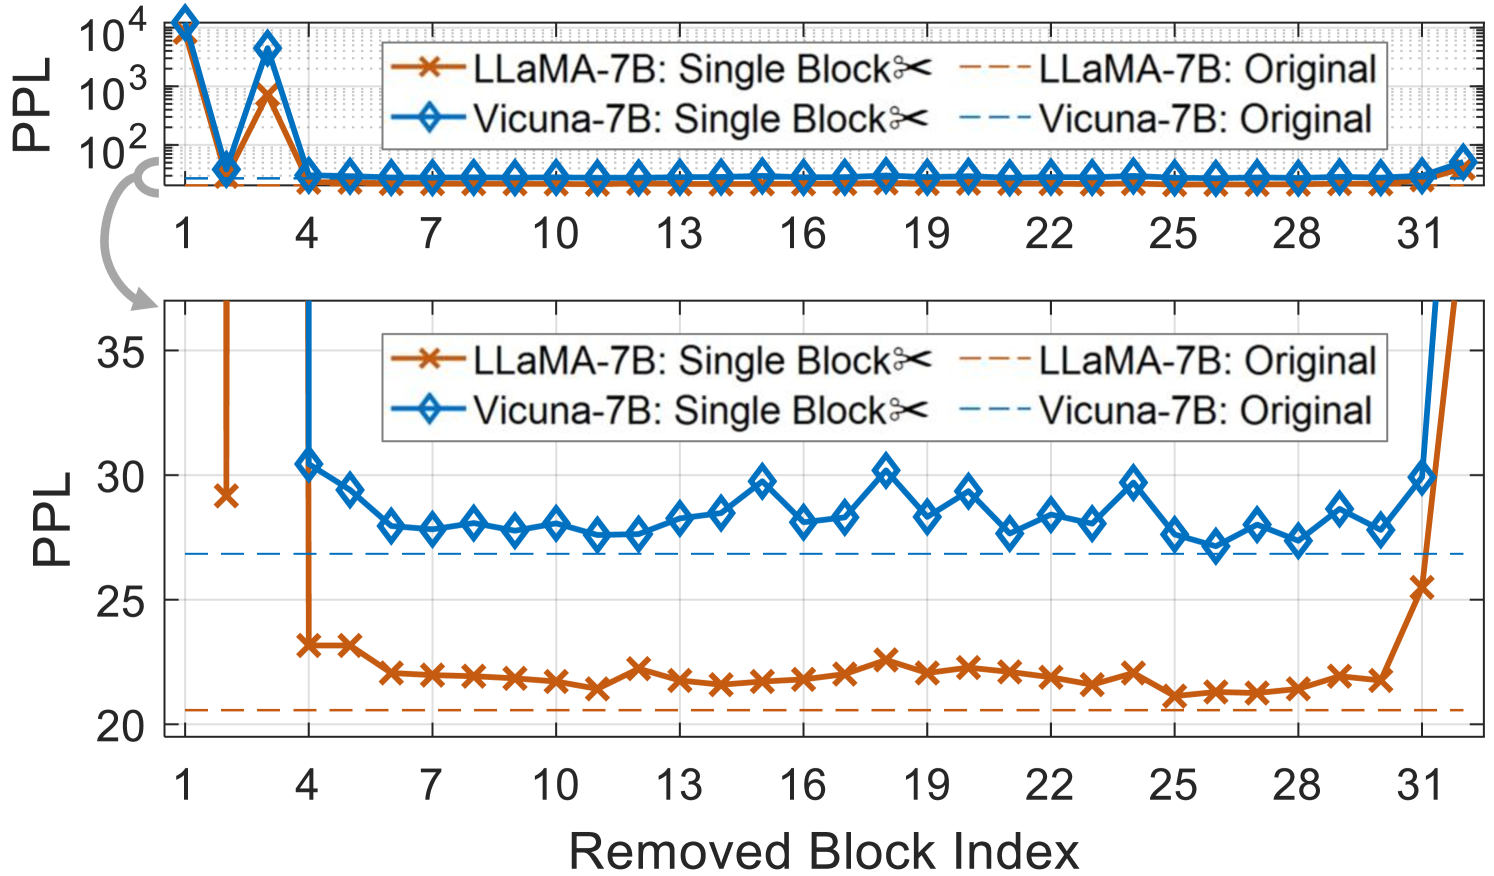
The image displays two vertically stacked plots analyzing the Perplexity (PPL) of two language models (LLaMA-7B and Vicuna-7B) as a function of the "Removed Block Index" (x-axis, 1–31). The top plot uses a **logarithmic y-axis** (PPL: \(10^2\) to \(10^4\)), while the bottom plot uses a **linear y-axis** (PPL: 20–35). Four data series are plotted:
- LLaMA-7B: Single Block (orange crosses)
- LLaMA-7B: Original (orange dashed line)
- Vicuna-7B: Single Block (blue diamonds)
- Vicuna-7B: Original (blue dashed line)
### Components/Axes
- **X-axis (both plots)**: "Removed Block Index" with ticks at 1, 4, 7, 10, 13, 16, 19, 22, 25, 28, 31.
- **Y-axis (top plot)**: "PPL" (logarithmic scale: \(10^2\), \(10^3\), \(10^4\)).
- **Y-axis (bottom plot)**: "PPL" (linear scale: 20, 25, 30, 35).
- **Legend (both plots)**:
- Orange cross: LLaMA-7B: Single Block
- Orange dashed line: LLaMA-7B: Original
- Blue diamond: Vicuna-7B: Single Block
- Blue dashed line: Vicuna-7B: Original
### Detailed Analysis (Top Plot: Logarithmic PPL)
- **LLaMA-7B: Single Block (orange crosses)**:
- Index 1: PPL ≈ \(10^4\) (10,000, extremely high).
- Index 4: Drops sharply to ≈ \(10^2\) (100).
- Indices 4–30: Remains stable at ≈ \(10^2\) (100).
- Index 31: Slight rise to ≈ \(10^{2.1}\) (≈126).
- **Vicuna-7B: Single Block (blue diamonds)**:
- Index 1: PPL ≈ \(10^4\) (10,000, same as LLaMA-7B).
- Index 4: Drops to ≈ \(10^2\) (100).
- Indices 4–30: Remains stable at ≈ \(10^2\) (100).
- Index 31: Slight rise to ≈ \(10^{2.1}\) (≈126).
- **LLaMA-7B: Original (orange dashed line)**: Horizontal line at ≈ \(10^2\) (100, constant PPL).
- **Vicuna-7B: Original (blue dashed line)**: Horizontal line at ≈ \(10^2\) (100, constant PPL).
### Detailed Analysis (Bottom Plot: Linear PPL)
- **LLaMA-7B: Single Block (orange crosses)**:
- Index 1: PPL ≈ 30.
- Index 4: Drops to ≈ 23.
- Indices 4–30: Fluctuates slightly (≈22–23).
- Index 31: Rises to ≈ 25.
- **Vicuna-7B: Single Block (blue diamonds)**:
- Index 1: PPL ≈ 30 (same as LLaMA-7B).
- Index 4: PPL ≈ 30 (no drop, unlike LLaMA-7B).
- Indices 4–30: Fluctuates (≈27–30, with peaks at indices 19, 25).
- Index 31: Rises to ≈ 30.
- **LLaMA-7B: Original (orange dashed line)**: Horizontal line at ≈ 20 (constant PPL).
- **Vicuna-7B: Original (blue dashed line)**: Horizontal line at ≈ 27 (constant PPL).
### Key Observations
1. **Initial Spike (Index 1)**: Both models have extremely high PPL when the first block is removed, indicating the first block is critical for performance.
2. **Drop at Index 4**: LLaMA-7B’s PPL drops sharply at index 4, while Vicuna-7B’s PPL remains high (≈30) until later indices.
3. **Stability (Indices 4–30)**: LLaMA-7B’s PPL stabilizes at a lower value (≈22–23) than Vicuna-7B (≈27–30) in the linear plot.
4. **Final Rise (Index 31)**: Both models show a PPL increase at index 31, suggesting the last block is also important (though less so than the first).
5. **Original Models**: LLaMA-7B Original has lower PPL (≈20) than Vicuna-7B Original (≈27), indicating LLaMA-7B performs better in its original form.
### Interpretation
- **Block Importance**: The first block (index 1) is critical for both models (removing it causes a massive PPL spike). Blocks 2–3 are less critical (performance recovers after index 1).
- **Model Comparison**: LLaMA-7B outperforms Vicuna-7B (lower PPL) when blocks are removed (except at index 1), suggesting LLaMA-7B is more robust to block removal.
- **Original vs. Single Block**: Removing blocks generally degrades performance (single-block PPL > original PPL), but the degradation is less severe after the first block.
- **Anomaly at Index 31**: The rise in PPL at index 31 implies the last block also contributes to performance, though its impact is smaller than the first block.
This analysis reveals the critical role of the first block in model performance and highlights differences in robustness between LLaMA-7B and Vicuna-7B.