## Line Chart: Perplexity (PPL) Analysis Across Removed Block Indices
### Overview
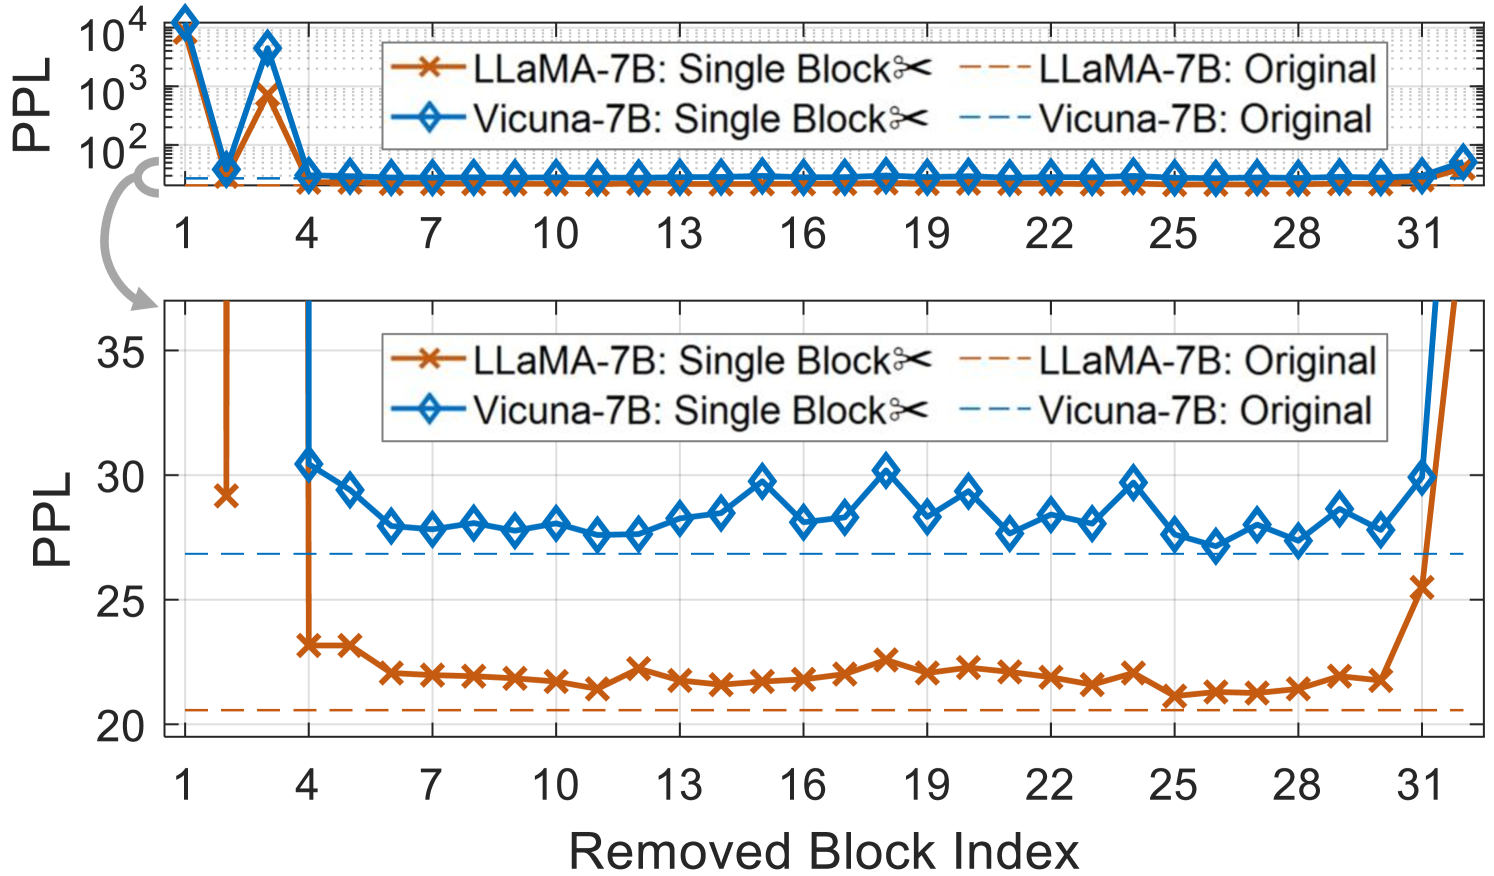
The image contains two vertically stacked line charts comparing the perplexity (PPL) of two language models (LaMA-7B and Vicuna-7B) when individual blocks are removed. The top subplot uses a logarithmic scale for PPL (10² to 10⁴), while the bottom subplot uses a linear scale (20 to 35). Both charts track PPL changes as blocks 1–31 are removed sequentially.
---
### Components/Axes
- **X-axis (Both Subplots):**
- Label: "Removed Block Index"
- Ticks: 1, 4, 7, 10, 13, 16, 19, 22, 25, 28, 31
- Scale: Linear (1–31)
- **Y-axis (Top Subplot):**
- Label: "PPL"
- Scale: Logarithmic (10² to 10⁴)
- **Y-axis (Bottom Subplot):**
- Label: "PPL"
- Scale: Linear (20 to 35)
- **Legends:**
- **Top Subplot (Top-Right Corner):**
- LaMA-7B: Single Block (red crosses)
- LaMA-7B: Original (dashed red line)
- Vicuna-7B: Single Block (blue diamonds)
- Vicuna-7B: Original (dashed blue line)
- **Bottom Subplot (Bottom-Right Corner):**
- Identical labels to the top subplot, with the same color/marker mappings.
---
### Detailed Analysis
#### Top Subplot (Logarithmic Scale)
- **LaMA-7B: Single Block**
- Sharp spike at block 1 (≈10⁴ PPL).
- Secondary spike at block 4 (≈10³ PPL).
- Drops to baseline (≈10² PPL) after block 4, remaining flat until block 31.
- **LaMA-7B: Original**
- Dashed red line overlaps with "Single Block" at blocks 1 and 4.
- Remains flat (≈10² PPL) after block 4.
- **Vicuna-7B: Single Block**
- Spike at block 1 (≈10³ PPL).
- Secondary spike at block 4 (≈10² PPL).
- Drops to baseline (≈10² PPL) after block 4, remaining flat until block 31.
- **Vicuna-7B: Original**
- Dashed blue line overlaps with "Single Block" at blocks 1 and 4.
- Remains flat (≈10² PPL) after block 4.
#### Bottom Subplot (Linear Scale)
- **LaMA-7B: Single Block**
- Spike at block 1 (≈30 PPL).
- Secondary spike at block 4 (≈24 PPL).
- Drops to baseline (≈22 PPL) after block 4, remaining flat until block 31.
- Final spike at block 31 (≈35 PPL).
- **LaMA-7B: Original**
- Dashed red line overlaps with "Single Block" at blocks 1 and 4.
- Remains flat (≈22 PPL) after block 4.
- **Vicuna-7B: Single Block**
- Spike at block 1 (≈28 PPL).
- Secondary spike at block 4 (≈26 PPL).
- Drops to baseline (≈25 PPL) after block 4, remaining flat until block 31.
- **Vicuna-7B: Original**
- Dashed blue line overlaps with "Single Block" at blocks 1 and 4.
- Remains flat (≈25 PPL) after block 4.
---
### Key Observations
1. **Initial Spikes:** Both models exhibit significant PPL increases when blocks 1 and 4 are removed, with LaMA-7B showing larger spikes (especially in the logarithmic scale).
2. **Stability Post-Block 4:** After block 4, PPL stabilizes for both models until block 31.
3. **Final Spike (Block 31):** LaMA-7B shows a sharp PPL increase at block 31 (≈35 PPL in linear scale), while Vicuna-7B remains stable.
4. **Scale Differences:** The logarithmic scale emphasizes the magnitude of early spikes, while the linear scale highlights absolute differences in later trends.
---
### Interpretation
- **Model Sensitivity:** LaMA-7B is more sensitive to block removal, as evidenced by higher PPL spikes (e.g., 10⁴ vs. 10³ in the top subplot). This suggests critical dependencies on early blocks.
- **Robustness:** Vicuna-7B demonstrates greater stability, with smaller spikes and consistent PPL after block 4.
- **Block 31 Anomaly:** The final spike in LaMA-7B at block 31 may indicate a structurally critical block whose removal disrupts model performance.
- **Original vs. Single Block:** The overlapping "Original" and "Single Block" lines at blocks 1 and 4 imply that removing these blocks has a comparable impact to the original configuration.
This analysis highlights the importance of early blocks in maintaining model coherence, with LaMA-7B being more vulnerable to structural changes than Vicuna-7B.