\n
## Line Chart: Pass@k vs. k for Different Models
### Overview
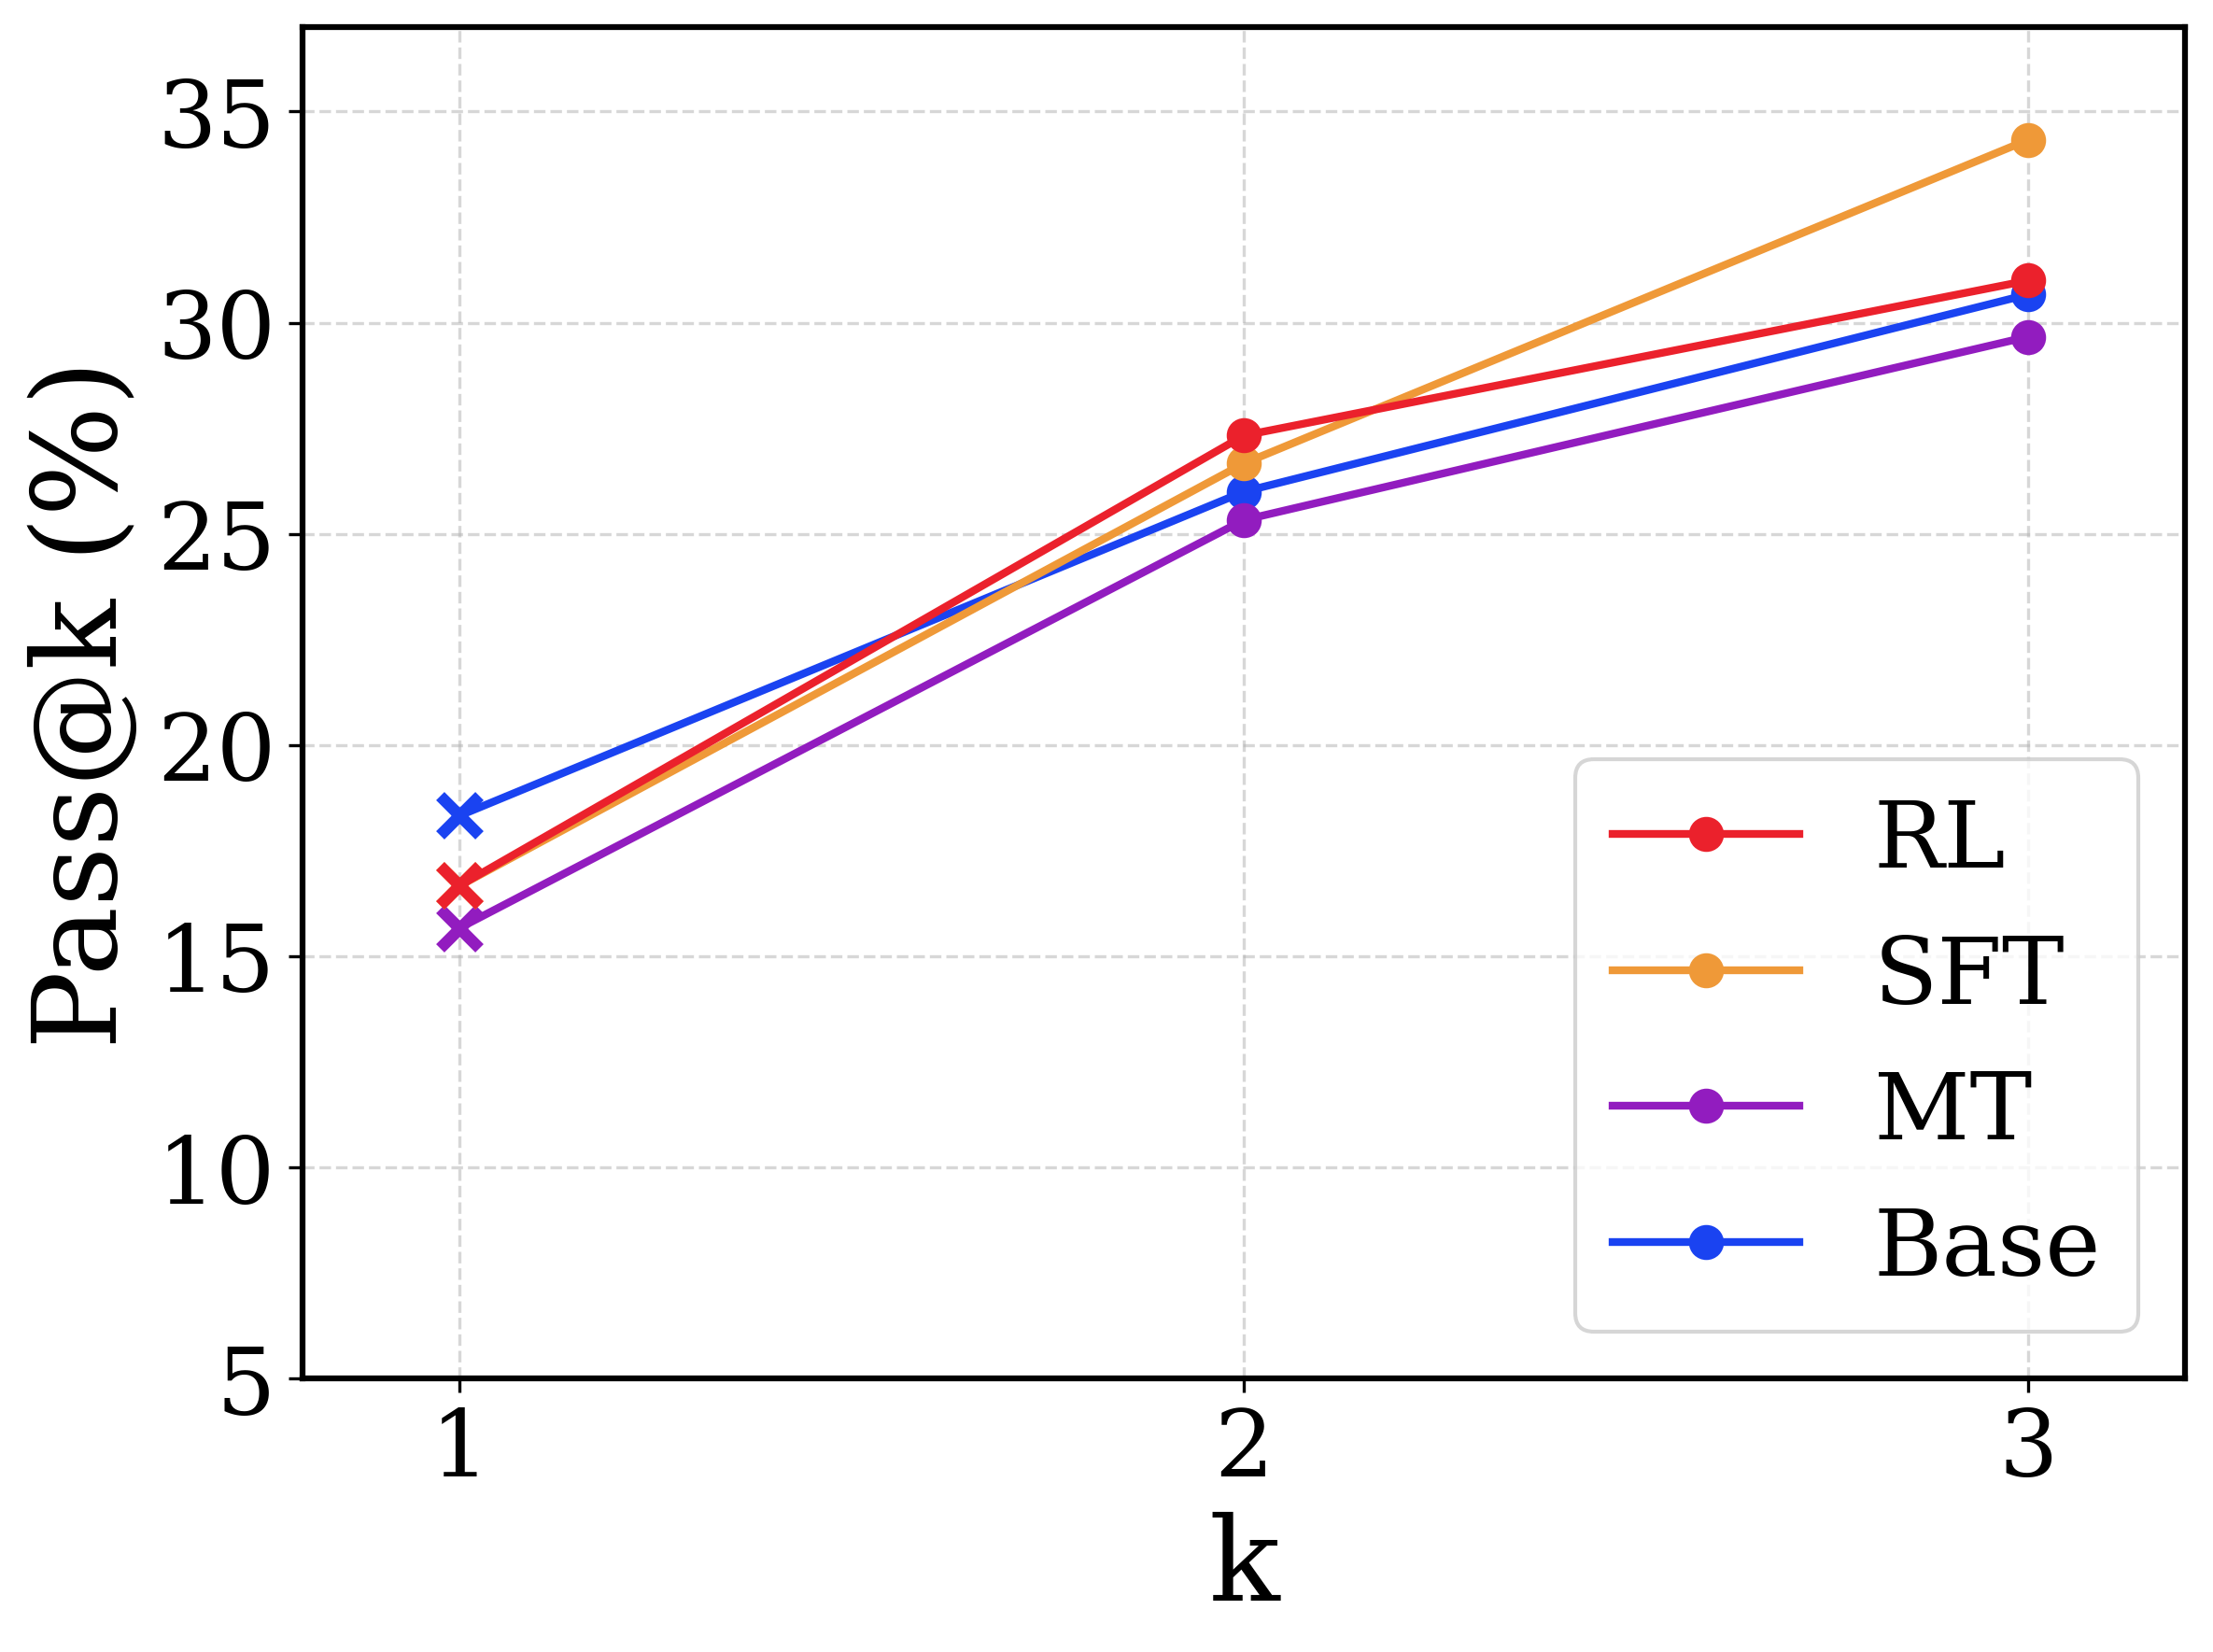
This image presents a line chart comparing the Pass@k metric for four different models (RL, SFT, MT, and Base) across varying values of 'k' (1, 2, and 3). The chart visualizes how the percentage of successful passes changes as the value of 'k' increases for each model.
### Components/Axes
* **X-axis:** Labeled "k", with values 1, 2, and 3.
* **Y-axis:** Labeled "Pass@k (%)", with a scale ranging from 5% to 35%.
* **Legend:** Located in the top-right corner, identifying the four data series:
* RL (Red)
* SFT (Orange)
* MT (Purple)
* Base (Blue)
* **Gridlines:** Present to aid in reading values.
### Detailed Analysis
Let's analyze each line and extract the approximate data points.
* **RL (Red):** The line slopes upward, indicating an increase in Pass@k as k increases.
* k = 1: Approximately 17%
* k = 2: Approximately 27%
* k = 3: Approximately 31%
* **SFT (Orange):** The line shows a significant increase from k=1 to k=2, then a smaller increase from k=2 to k=3.
* k = 1: Approximately 19%
* k = 2: Approximately 27%
* k = 3: Approximately 34%
* **MT (Purple):** The line slopes upward, but less steeply than RL and SFT.
* k = 1: Approximately 16%
* k = 2: Approximately 26%
* k = 3: Approximately 30%
* **Base (Blue):** The line shows a moderate increase from k=1 to k=2, and a smaller increase from k=2 to k=3.
* k = 1: Approximately 15%
* k = 2: Approximately 23%
* k = 3: Approximately 29%
### Key Observations
* The SFT model consistently achieves the highest Pass@k values across all 'k' values.
* The RL and MT models perform similarly, with RL slightly outperforming MT at k=3.
* The Base model consistently has the lowest Pass@k values.
* All models show an improvement in Pass@k as 'k' increases, but the rate of improvement varies.
### Interpretation
The chart demonstrates the impact of different model training approaches (RL, SFT, MT, and Base) on the Pass@k metric, which likely represents the success rate of a model in passing a certain test or benchmark. The 'k' parameter likely represents the number of attempts or samples considered.
The superior performance of the SFT model suggests that supervised fine-tuning is an effective strategy for improving the model's ability to pass the test. The increasing Pass@k values with increasing 'k' indicate that allowing the model more attempts or considering more samples improves its chances of success.
The differences between the models suggest that the training data and methods used have a significant impact on performance. The Base model's lower performance may indicate that it lacks the specific knowledge or skills required to succeed on the test. The relatively small difference between k=2 and k=3 for all models suggests diminishing returns as 'k' increases, indicating that there may be a point where additional attempts or samples do not significantly improve performance.