# Technical Document Extraction: Line Chart Analysis
## 1. Axis Labels and Markers
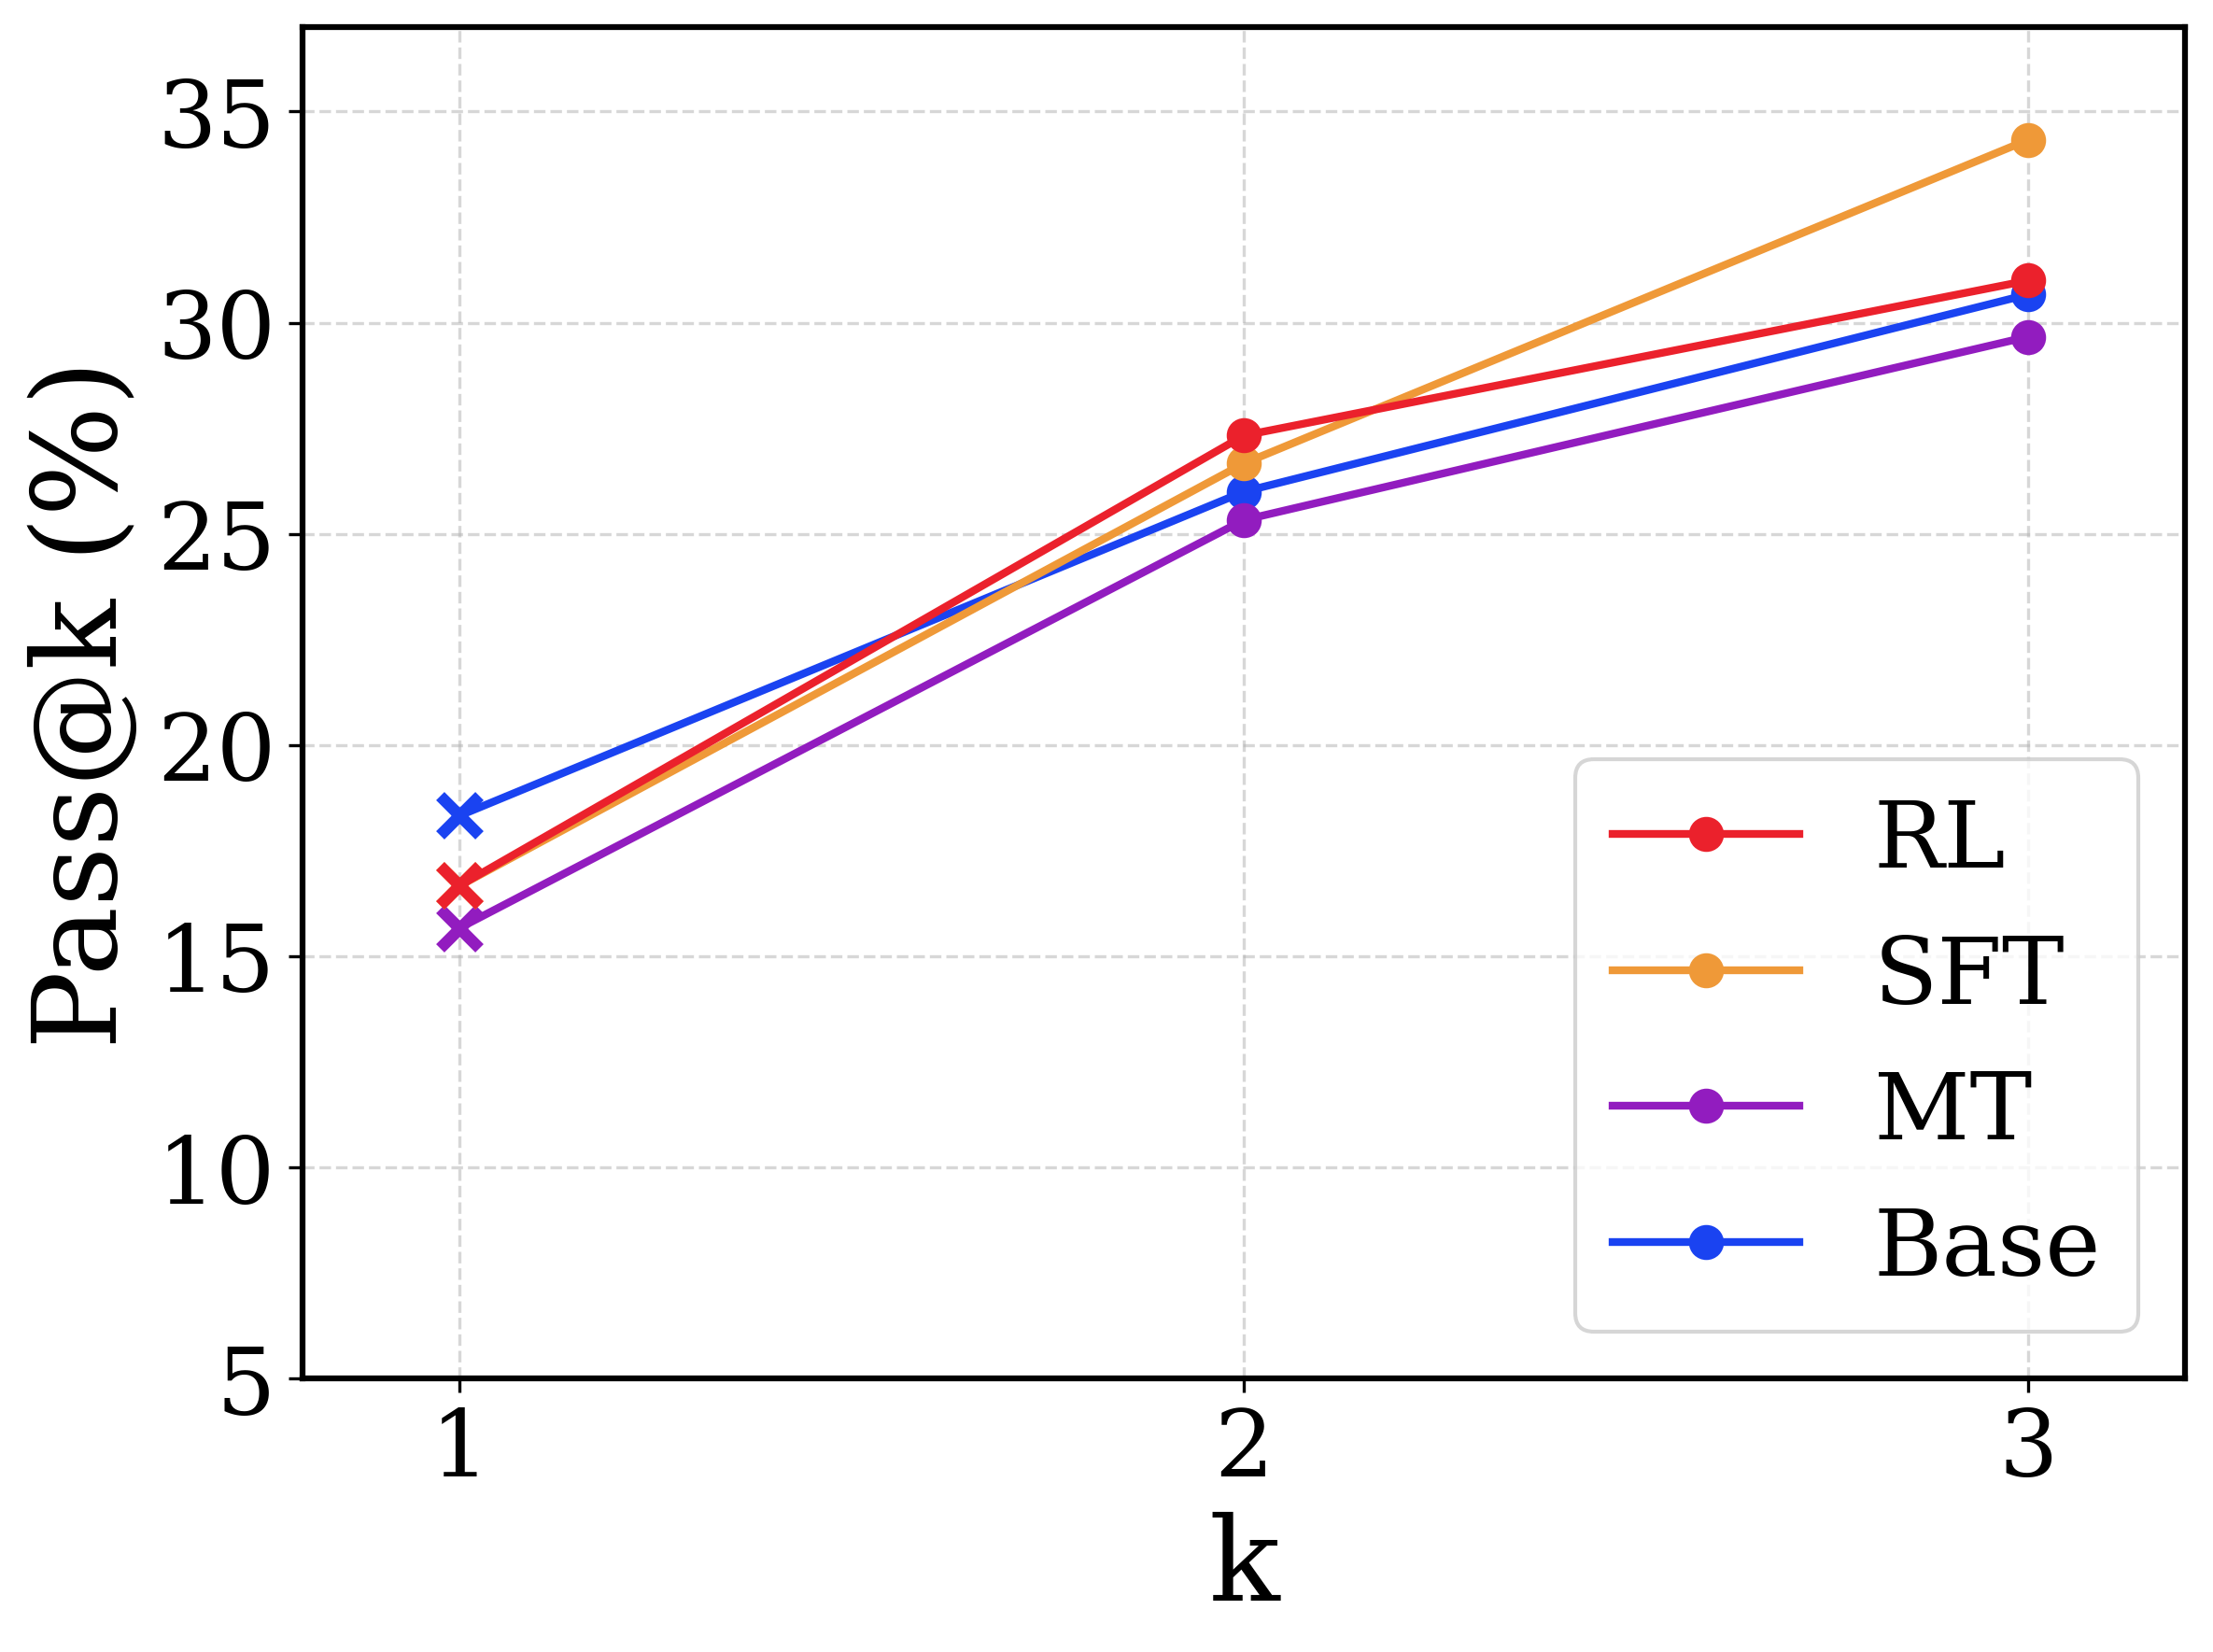
- **X-axis**: Labeled "k" with discrete ticks at positions 1, 2, 3.
- **Y-axis**: Labeled "Pass@k (%)" with a range from 5% to 35%, incremented by 5%.
- **Grid**: Dashed gray gridlines for reference.
## 2. Legend and Color Mapping
- **Legend Position**: Lower-right quadrant of the chart.
- **Color-Label Mapping**:
- **Red**: RL (Reinforcement Learning)
- **Orange**: SFT (Softmax Fine-Tuning)
- **Purple**: MT (Model Tuning)
- **Blue**: Base (Baseline)
## 3. Data Series and Trends
### RL (Red Line)
- **Trend**: Steady upward slope with moderate curvature.
- **Data Points**:
- k=1: ~17%
- k=2: ~27%
- k=3: ~31%
### SFT (Orange Line)
- **Trend**: Sharpest upward trajectory, most aggressive growth.
- **Data Points**:
- k=1: ~16%
- k=2: ~26%
- k=3: ~34.5%
### MT (Purple Line)
- **Trend**: Consistent linear increase, least curvature.
- **Data Points**:
- k=1: ~15.5%
- k=2: ~25.5%
- k=3: ~30%
### Base (Blue Line)
- **Trend**: Slightly curved upward, closely follows RL.
- **Data Points**:
- k=1: ~18.5%
- k=2: ~26%
- k=3: ~30.5%
## 4. Spatial Grounding
- **Legend**: Located at [x=0.85, y=0.15] (normalized coordinates).
- **Data Point Verification**:
- All line colors match legend labels (e.g., red = RL, orange = SFT).
## 5. Key Observations
- **Performance Gaps**:
- At k=3, SFT outperforms all methods by ~4.5% over RL and ~4% over Base.
- MT consistently lags by ~1–2% compared to RL/Base.
- **Scalability**: All methods improve with increasing k, but SFT shows the highest scalability.
## 6. Missing Elements
- No embedded text, tables, or non-English content detected.
- No heatmap or multi-category sub-categories present.
## 7. Final Data Table Reconstruction
| k | RL (%) | SFT (%) | MT (%) | Base (%) |
|----|--------|---------|--------|----------|
| 1 | 17 | 16 | 15.5 | 18.5 |
| 2 | 27 | 26 | 25.5 | 26 |
| 3 | 31 | 34.5 | 30 | 30.5 |