## Chart: Validation Loss vs. Training Tokens for Different FLOPs
### Overview
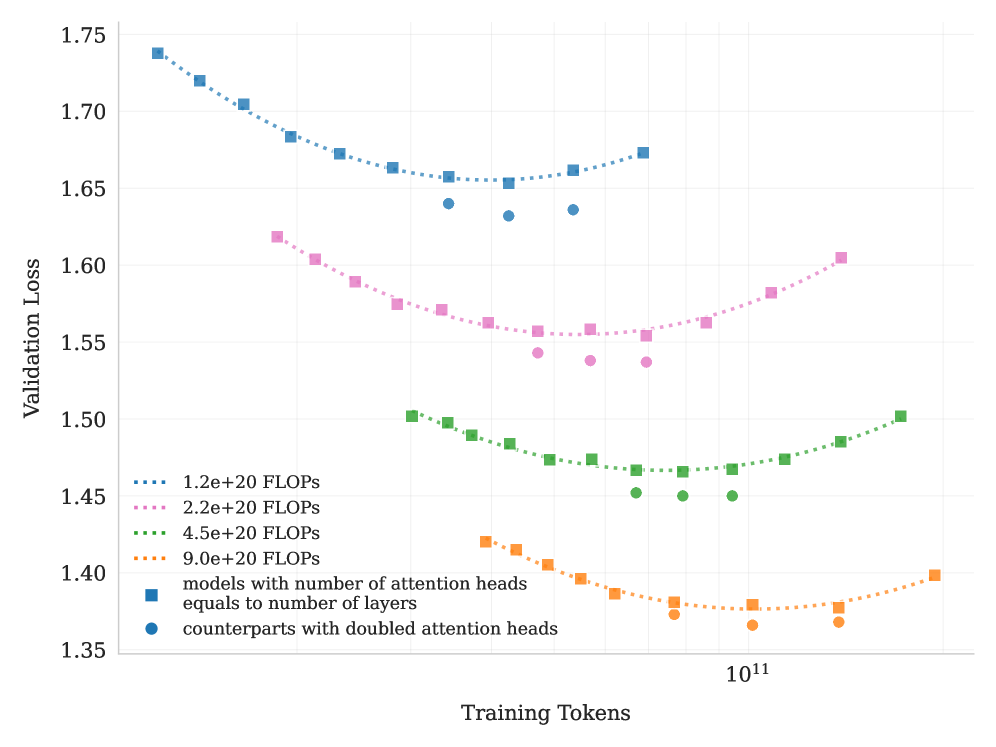
The image is a line chart showing the relationship between validation loss and training tokens for models with different FLOPs (Floating Point Operations per Second). The chart compares models where the number of attention heads equals the number of layers against counterparts with doubled attention heads.
### Components/Axes
* **X-axis:** Training Tokens (logarithmic scale, base 10). The only explicit marker is 10^11.
* **Y-axis:** Validation Loss (linear scale). Markers are at 1.35, 1.40, 1.45, 1.50, 1.55, 1.60, 1.65, 1.70, and 1.75.
* **Legend (located on the left side of the chart):**
* Blue dotted line: 1.2e+20 FLOPS
* Pink dotted line: 2.2e+20 FLOPS
* Green dotted line: 4.5e+20 FLOPS
* Orange dotted line: 9.0e+20 FLOPS
* Blue squares: models with number of attention heads equals to number of layers
* Blue circles: counterparts with doubled attention heads
### Detailed Analysis
* **1.2e+20 FLOPS (Blue dotted line with blue squares):**
* Trend: Decreases initially, reaches a minimum, then increases slightly.
* Approximate values: Starts at approximately 1.74, reaches a minimum around 1.66 at 10^11 training tokens, then increases to approximately 1.67.
* Blue circles (doubled attention heads) are present at approximately 1.64 validation loss at 10^11 training tokens.
* **2.2e+20 FLOPS (Pink dotted line with pink squares):**
* Trend: Decreases initially, reaches a minimum, then increases.
* Approximate values: Starts at approximately 1.62, reaches a minimum around 1.56 at 10^11 training tokens, then increases to approximately 1.60.
* Pink circles (doubled attention heads) are present at approximately 1.55 validation loss at 10^11 training tokens.
* **4.5e+20 FLOPS (Green dotted line with green squares):**
* Trend: Decreases initially, reaches a minimum, then increases.
* Approximate values: Starts at approximately 1.50, reaches a minimum around 1.45 at 10^11 training tokens, then increases to approximately 1.50.
* Green circles (doubled attention heads) are present at approximately 1.45 validation loss at 10^11 training tokens.
* **9.0e+20 FLOPS (Orange dotted line with orange squares):**
* Trend: Decreases initially, reaches a minimum, then increases.
* Approximate values: Starts at approximately 1.42, reaches a minimum around 1.37 at 10^11 training tokens, then increases to approximately 1.40.
* Orange circles (doubled attention heads) are present at approximately 1.37 validation loss at 10^11 training tokens.
### Key Observations
* As the number of FLOPS increases, the validation loss generally decreases.
* All lines exhibit a U-shaped curve, indicating an optimal number of training tokens beyond which performance degrades (overfitting).
* The counterparts with doubled attention heads (circles) generally have a slightly lower validation loss than the models with the number of attention heads equal to the number of layers (squares) at 10^11 training tokens.
### Interpretation
The chart demonstrates the impact of computational resources (FLOPS) and training data (tokens) on the performance of a model, as measured by validation loss. Increasing FLOPS generally leads to lower validation loss, suggesting better model performance. However, the U-shaped curves indicate that there is an optimal amount of training data. Beyond this point, the model begins to overfit, and the validation loss increases. The models with doubled attention heads show a slight improvement in validation loss compared to the standard models, suggesting that increasing the number of attention heads can improve performance. The chart highlights the importance of balancing model size, computational resources, and training data to achieve optimal performance.