## Line Chart: Validation Loss vs Training Tokens
### Overview
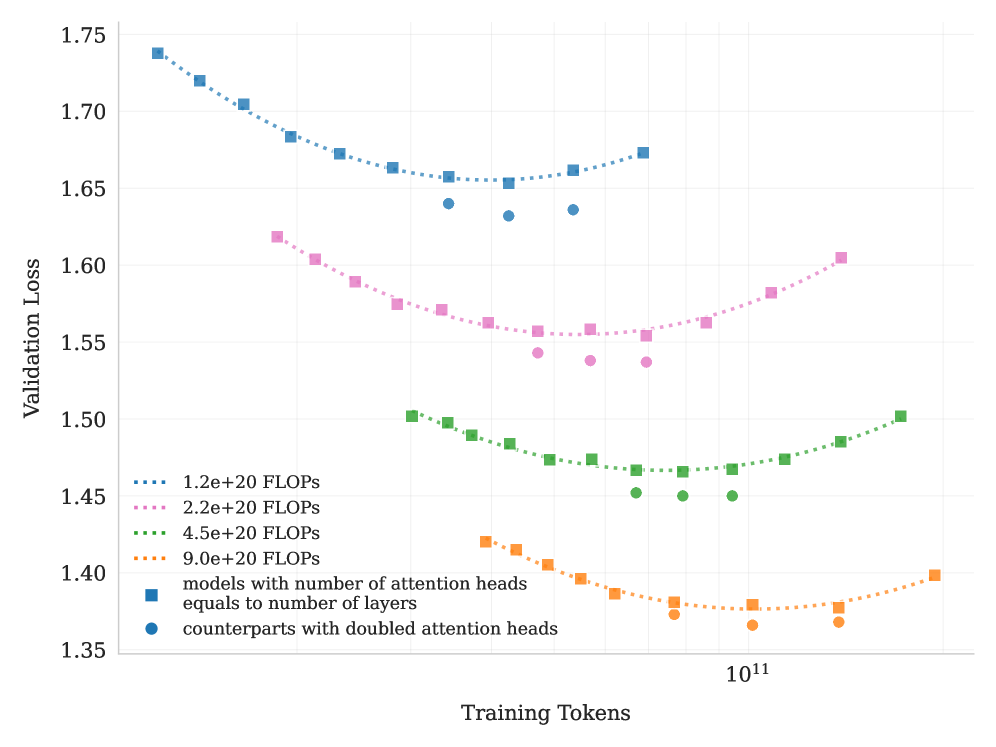
The chart illustrates the relationship between validation loss and training tokens for different model configurations and computational budgets. It shows multiple data series with distinct trends, highlighting how model architecture and computational resources impact performance.
### Components/Axes
- **Y-axis**: Validation Loss (1.35 to 1.75)
- **X-axis**: Training Tokens (10¹¹ to 10¹²)
- **Legend**:
- Blue squares: Models with attention heads equal to number of layers
- Blue circles: Counterparts with doubled attention heads
- Pink squares: 2.2e+20 FLOPs
- Green squares: 4.5e+20 FLOPs
- Orange squares: 9.0e+20 FLOPs
- Blue dotted line: 1.2e+20 FLOPs
### Detailed Analysis
1. **Blue Squares (Models with attention heads = layers)**:
- Starts at ~1.74 validation loss at 10¹¹ tokens
- Dips to ~1.65 at 10¹² tokens
- Shows a U-shaped curve with a minimum around 10¹¹.5 tokens
2. **Blue Circles (Doubled attention heads)**:
- Starts at ~1.64 validation loss at 10¹¹ tokens
- Dips to ~1.58 at 10¹² tokens
- Maintains lower loss than blue squares throughout
3. **Pink Squares (2.2e+20 FLOPs)**:
- Starts at ~1.62 validation loss at 10¹¹ tokens
- Dips to ~1.56 at 10¹² tokens
- Shows gradual improvement with more tokens
4. **Green Squares (4.5e+20 FLOPs)**:
- Starts at ~1.50 validation loss at 10¹¹ tokens
- Dips to ~1.45 at 10¹² tokens
- Maintains lowest loss among FLOPs-based series
5. **Orange Squares (9.0e+20 FLOPs)**:
- Starts at ~1.42 validation loss at 10¹¹ tokens
- Dips to ~1.38 at 10¹² tokens
- Shows U-shaped curve with minimum at 10¹¹.5 tokens
6. **Blue Dotted Line (1.2e+20 FLOPs)**:
- Starts at ~1.74 validation loss at 10¹¹ tokens
- Dips to ~1.65 at 10¹² tokens
- Shows consistent downward trend
### Key Observations
- **Architecture Impact**: Models with doubled attention heads (blue circles) consistently outperform standard configurations (blue squares) across all token ranges.
- **FLOPs Correlation**: Higher computational budgets (orange > green > pink) correlate with lower validation loss.
- **Training Token Effect**: All series show improved performance with more training tokens, though the rate of improvement varies.
- **1.2e+20 FLOPs Trend**: The blue dotted line demonstrates the most significant improvement (1.74 → 1.65) with increased tokens.
### Interpretation
The data suggests a complex interplay between model architecture and computational resources:
1. **Attention Head Scaling**: Doubling attention heads provides a ~0.06 validation loss advantage over standard configurations, indicating architectural efficiency gains.
2. **FLOPs vs Architecture**: While higher FLOPs generally improve performance, the 9.0e+20 FLOPs series (orange) shows diminishing returns compared to architectural improvements (blue circles).
3. **Training Token Efficiency**: The 1.2e+20 FLOPs series (blue dotted line) demonstrates that even with limited computational resources, extended training can yield substantial improvements.
4. **U-Shaped Curves**: Multiple series show initial improvement followed by plateauing, suggesting optimal performance at mid-range token counts before potential overfitting or diminishing returns.
This analysis reveals that both architectural choices (attention head scaling) and computational investment (FLOPs) significantly impact model performance, with architectural improvements often providing better returns than raw computational power alone.