## Diagram: Logic-Structured Dataset Construction and Structure-Aware Reward Modeling
### Overview
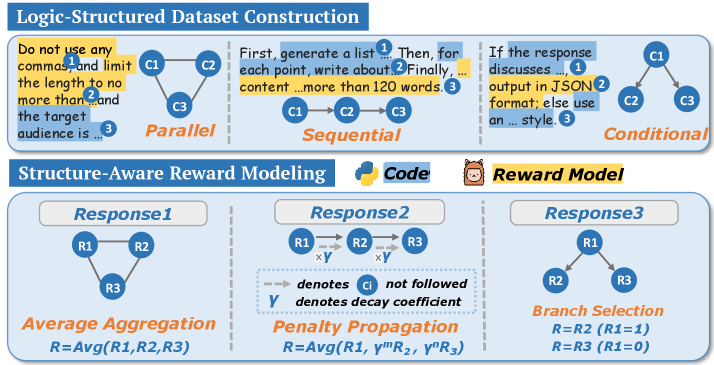
The image presents two distinct diagrams: "Logic-Structured Dataset Construction" and "Structure-Aware Reward Modeling." The first diagram illustrates three approaches to dataset construction: Parallel, Sequential, and Conditional. The second diagram details three methods for reward modeling: Average Aggregation, Penalty Propagation, and Branch Selection.
### Components/Axes
**Logic-Structured Dataset Construction:**
* **Title:** Logic-Structured Dataset Construction
* **Nodes:** C1, C2, C3 (representing content components)
* **Edges:** Arrows indicating flow or relationships between nodes.
* **Textual Annotations:**
* "Do not use any commas and limit the length to no more than...and the target audience is..." (associated with Parallel)
* "First, generate a list... Then, for each point, write about. Finally, content ...more than 120 words." (associated with Sequential)
* "If the response discusses..., output in JSON format; else use an ... style." (associated with Conditional)
* **Types:**
* Parallel: C1, C2, and C3 are connected in a triangular formation.
* Sequential: C1 -> C2 -> C3 (linear flow)
* Conditional: C1 branches to C2 and C3.
**Structure-Aware Reward Modeling:**
* **Title:** Structure-Aware Reward Modeling
* **Sub-titles:** Response1, Response2, Response3
* **Nodes:** R1, R2, R3 (representing response components)
* **Edges:** Arrows indicating flow or relationships between nodes. Dashed arrows indicate "Ci not followed".
* **Y:** Denotes decay coefficient.
* **Reward Model Icon:** A cartoon bear face.
* **Code Icon:** A python logo.
* **Types:**
* Average Aggregation: R1, R2, and R3 are connected in a triangular formation. R = Avg(R1, R2, R3)
* Penalty Propagation: R1 -> R2 -> R3, with decay coefficient Y applied between each node. R = Avg(R1, Y^mR2, Y^nR3)
* Branch Selection: R1 branches to R2 and R3. R = R2 (R1=1), R = R3 (R1=0)
### Detailed Analysis or ### Content Details
**Logic-Structured Dataset Construction:**
* **Parallel:** The diagram shows C1, C2, and C3 connected in a triangular shape, indicating a parallel relationship. The associated text emphasizes avoiding commas, limiting length, and targeting the audience.
* **Sequential:** The diagram shows a linear flow from C1 to C2 to C3. The associated text describes generating a list, writing about each point, and ensuring the content exceeds 120 words.
* **Conditional:** The diagram shows C1 branching to C2 and C3, indicating a conditional relationship. The associated text describes outputting in JSON format if the response discusses a certain topic, otherwise using a different style.
**Structure-Aware Reward Modeling:**
* **Average Aggregation:** R1, R2, and R3 are interconnected. The reward is calculated as the average of R1, R2, and R3.
* **Penalty Propagation:** The reward propagates from R1 to R2 to R3, with a decay coefficient (Y) applied at each step. The reward is calculated as the average of R1, Y^mR2, and Y^nR3.
* **Branch Selection:** The reward is selected based on the value of R1. If R1=1, the reward is R2. If R1=0, the reward is R3.
### Key Observations
* The "Logic-Structured Dataset Construction" section focuses on different ways to structure content components (C1, C2, C3) based on specific guidelines.
* The "Structure-Aware Reward Modeling" section focuses on different ways to calculate a reward based on response components (R1, R2, R3) and their relationships.
* The use of arrows indicates the flow of information or dependencies between components.
* The decay coefficient (Y) in "Penalty Propagation" suggests a diminishing effect as the reward propagates through the response components.
### Interpretation
The diagrams illustrate different strategies for constructing datasets and modeling rewards. The "Logic-Structured Dataset Construction" section provides guidelines for organizing content based on parallel, sequential, or conditional relationships. The "Structure-Aware Reward Modeling" section presents methods for calculating rewards based on the structure of responses, including averaging, penalizing propagation, and selecting branches. The choice of method depends on the specific requirements of the task and the desired behavior of the system. The decay coefficient in "Penalty Propagation" suggests a mechanism for prioritizing earlier response components over later ones. The branch selection method allows for conditional rewards based on the value of a specific component (R1).