## Diagram: Logic-Structured Dataset Construction and Structure-Aware Reward Modeling
### Overview
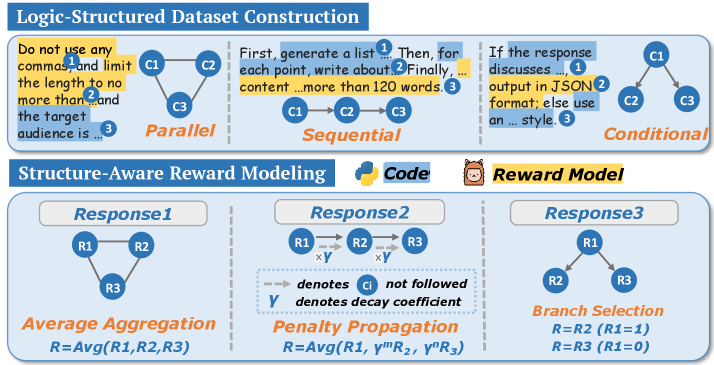
The diagram illustrates a two-part framework for constructing logic-structured datasets and modeling rewards based on response structures. It emphasizes constraints, response generation strategies, and reward calculation methods for different response types.
### Components/Axes
1. **Top Section: Logic-Structured Dataset Construction**
- **Parallel**:
- Constraints:
- "Do not use any commas, and limit the length to no more than 120 words."
- "The target audience is ..."
- Visual: Three interconnected nodes (C1, C2, C3) forming a triangle.
- **Sequential**:
- Steps:
1. Generate a list.
2. Write about content (max 120 words).
3. Output in JSON format; else use an `...` style.
- Visual: Linear flow (C1 → C2 → C3).
- **Conditional**:
- Logic: If the response discusses X, output in JSON; else use `...` style.
- Visual: Branching nodes (C1 → C2/C3).
2. **Bottom Section: Structure-Aware Reward Modeling**
- **Reward Model Components**:
- **Code**: Represented by a puzzle piece icon.
- **Reward Model**: Represented by a bear icon.
- **Response Types**:
- **Response1**:
- **Average Aggregation**: `R = Avg(R1, R2, R3)`.
- Visual: Triangle of nodes (R1, R2, R3) with bidirectional edges.
- **Response2**:
- **Penalty Propagation**: `R = Avg(R1, γᵐR₂, γⁿR₃)`.
- Visual: Linear flow (R1 → R2 → R3) with decay coefficients (γ, n).
- **Response3**:
- **Branch Selection**:
- `R = R2` if `R1 = 1`.
- `R = R3` if `R1 = 0`.
- Visual: Branching nodes (R1 → R2/R3).
### Detailed Analysis
- **Dataset Construction**:
- **Parallel**: Emphasizes brevity and audience targeting without commas.
- **Sequential**: Requires structured output (JSON) or fallback formatting.
- **Conditional**: Introduces logic-based output formatting.
- **Reward Modeling**:
- **Average Aggregation**: Simple mean of rewards.
- **Penalty Propagation**: Weighted average with decay factors for sequential dependencies.
- **Branch Selection**: Conditional reward assignment based on binary flags.
### Key Observations
- **Structural Constraints**: The diagram enforces strict formatting rules (e.g., no commas, JSON output).
- **Reward Complexity**: Reward calculations vary by response type, with penalties for misalignment and conditional logic for branching.
- **Visual Hierarchy**: Top section focuses on input constraints, while the bottom section details reward computation.
### Interpretation
The diagram demonstrates a systematic approach to aligning dataset construction with reward modeling. By structuring responses (parallel, sequential, conditional), the framework ensures consistency in data generation. The reward models adapt to these structures:
- **Average Aggregation** suits parallel responses with no dependencies.
- **Penalty Propagation** penalizes deviations in sequential responses using decay factors.
- **Branch Selection** optimizes rewards for conditional responses based on binary outcomes.
This design likely aims to improve model alignment with human preferences by explicitly encoding structural logic into both data generation and reward signals. The use of decay coefficients (γ, n) suggests an emphasis on temporal or hierarchical dependencies in sequential tasks.