## Line Chart: Model Accuracy vs. Step
### Overview
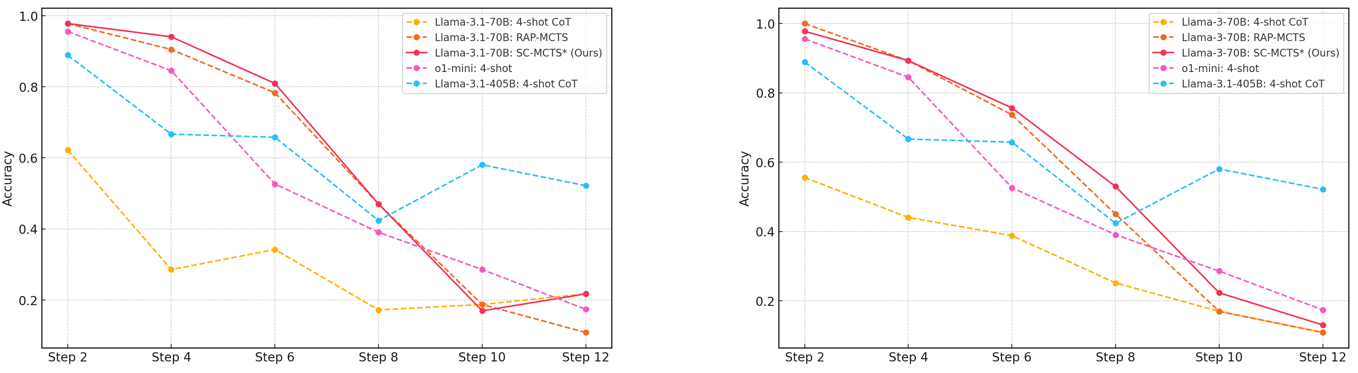
The image contains two line charts comparing the accuracy of different language models across several steps. The charts share the same legend and axes, allowing for a direct comparison of model performance. The x-axis represents the "Step" number, while the y-axis represents "Accuracy."
### Components/Axes
* **X-axis:** "Step" with markers at 2, 4, 6, 8, 10, and 12.
* **Y-axis:** "Accuracy" ranging from 0.2 to 1.0, with markers at 0.2, 0.4, 0.6, 0.8, and 1.0.
* **Legend (Top-Right):**
* Yellow dashed line: "Llama-3.1-70B: 4-shot CoT"
* Orange dashed line: "Llama-3.1-70B: RAP-MCTS"
* Red solid line: "Llama-3.1-70B: SC-MCTS* (Ours)"
* Pink dashed line: "o1-mini: 4-shot"
* Blue dashed line: "Llama-3.1-405B: 4-shot CoT"
### Detailed Analysis
**Left Chart:**
* **Llama-3.1-70B: 4-shot CoT (Yellow Dashed):** Starts at approximately 0.62 at Step 2, decreases to about 0.32 at Step 4, then to 0.34 at Step 6, drops to 0.18 at Step 8, remains at 0.18 at Step 10, and ends at approximately 0.22 at Step 12.
* **Llama-3.1-70B: RAP-MCTS (Orange Dashed):** Starts at approximately 0.98 at Step 2, decreases to about 0.88 at Step 4, then to 0.78 at Step 6, drops to 0.42 at Step 8, remains at 0.18 at Step 10, and ends at approximately 0.14 at Step 12.
* **Llama-3.1-70B: SC-MCTS* (Ours) (Red Solid):** Starts at approximately 0.98 at Step 2, decreases to about 0.92 at Step 4, then to 0.88 at Step 6, drops to 0.42 at Step 8, remains at 0.18 at Step 10, and ends at approximately 0.12 at Step 12.
* **o1-mini: 4-shot (Pink Dashed):** Starts at approximately 0.94 at Step 2, decreases to about 0.84 at Step 4, then to 0.74 at Step 6, drops to 0.44 at Step 8, remains at 0.20 at Step 10, and ends at approximately 0.14 at Step 12.
* **Llama-3.1-405B: 4-shot CoT (Blue Dashed):** Starts at approximately 0.92 at Step 2, decreases to about 0.68 at Step 4, then to 0.66 at Step 6, drops to 0.44 at Step 8, increases to 0.62 at Step 10, and ends at approximately 0.52 at Step 12.
**Right Chart:**
* **Llama-3-70B: 4-shot CoT (Yellow Dashed):** Starts at approximately 0.56 at Step 2, decreases to about 0.46 at Step 4, then to 0.34 at Step 6, drops to 0.24 at Step 8, remains at 0.18 at Step 10, and ends at approximately 0.12 at Step 12.
* **Llama-3-70B: RAP-MCTS (Orange Dashed):** Starts at approximately 1.00 at Step 2, decreases to about 0.92 at Step 4, then to 0.78 at Step 6, drops to 0.44 at Step 8, remains at 0.26 at Step 10, and ends at approximately 0.14 at Step 12.
* **Llama-3-70B: SC-MCTS* (Ours) (Red Solid):** Starts at approximately 0.98 at Step 2, decreases to about 0.90 at Step 4, then to 0.80 at Step 6, drops to 0.36 at Step 8, remains at 0.26 at Step 10, and ends at approximately 0.12 at Step 12.
* **o1-mini: 4-shot (Pink Dashed):** Starts at approximately 0.96 at Step 2, decreases to about 0.86 at Step 4, then to 0.76 at Step 6, drops to 0.38 at Step 8, remains at 0.24 at Step 10, and ends at approximately 0.12 at Step 12.
* **Llama-3.1-405B: 4-shot CoT (Blue Dashed):** Starts at approximately 0.90 at Step 2, decreases to about 0.68 at Step 4, then to 0.66 at Step 6, drops to 0.44 at Step 8, increases to 0.58 at Step 10, and ends at approximately 0.52 at Step 12.
### Key Observations
* The "Llama-3.1-70B: SC-MCTS* (Ours)" model (red line) generally starts with high accuracy but experiences a significant drop after Step 6.
* The "Llama-3.1-405B: 4-shot CoT" model (blue line) shows a different trend, with accuracy decreasing initially but then increasing slightly at Step 10 before decreasing again at Step 12.
* The "Llama-3.1-70B: 4-shot CoT" model (yellow line) consistently performs the worst across all steps in the left chart.
* The "Llama-3-70B: 4-shot CoT" model (yellow line) consistently performs the worst across all steps in the right chart.
* The other models ("Llama-3.1-70B: RAP-MCTS", "o1-mini: 4-shot") show a decreasing trend in accuracy as the step increases.
### Interpretation
The charts illustrate the performance of different language models over a series of steps, likely representing iterations or stages in a task. The decreasing accuracy of most models suggests a potential degradation in performance as the process continues. The "Llama-3.1-405B: 4-shot CoT" model's slight recovery at Step 10 could indicate a specific adaptation or adjustment within that model. The "SC-MCTS*" model, despite starting strong, appears to be susceptible to performance decline over time. The comparison between the left and right charts is not immediately clear without additional context, but the models in the right chart generally start with higher accuracy. The consistent underperformance of the "4-shot CoT" models suggests that the "Chain of Thought" method may not be as effective as other approaches for these specific models and tasks.