TECHNICAL ASSET FINGERPRINT
5f07eb0573b31be16510bdfd
Click to view fullscreen
Press ESC or click to close
FOUND IN PAPERS
EXPERT: healer-alpha-free VERSION 1
RUNTIME: free/openrouter/healer-alpha
INTEL_VERIFIED
## Line Charts: Model Accuracy Across Reasoning Steps
### Overview
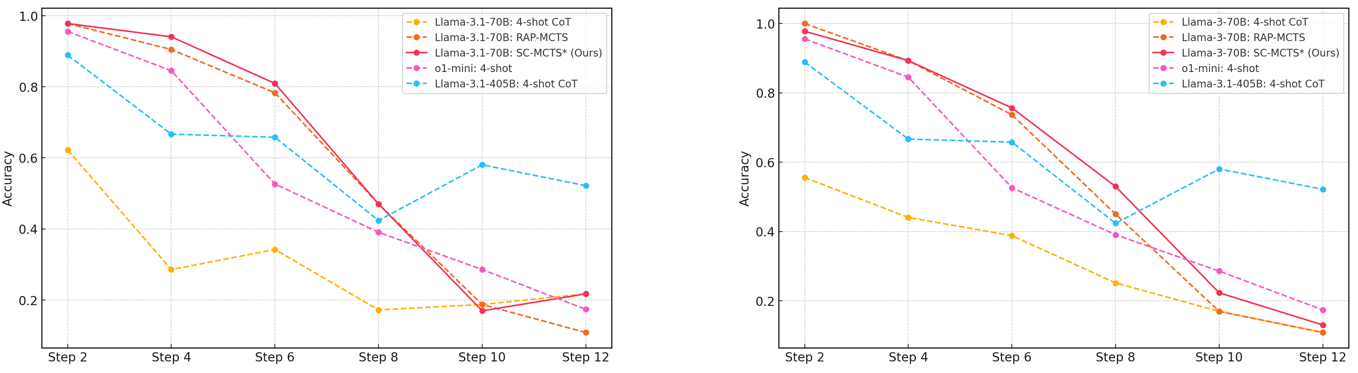
The image displays two side-by-side line charts comparing the accuracy of different large language models and reasoning methods across an increasing number of steps (from Step 2 to Step 12). The charts appear to be from a technical paper or report evaluating model performance on a multi-step reasoning task. The left chart features "Llama-3.1" models, while the right chart features "Llama-3" models, suggesting a comparison between model generations or versions.
### Components/Axes
**Common Elements (Both Charts):**
* **X-Axis:** Labeled "Step". Major tick marks are at Step 2, Step 4, Step 6, Step 8, Step 10, and Step 12.
* **Y-Axis:** Labeled "Accuracy". Scale ranges from 0.0 to 1.0, with major gridlines at 0.2 intervals (0.0, 0.2, 0.4, 0.6, 0.8, 1.0).
* **Legend:** Positioned in the top-right corner of each chart. Contains five entries with distinct line styles and colors.
* **Grid:** Light gray horizontal and vertical gridlines are present.
**Left Chart Specifics:**
* **Title/Context:** Implied to be evaluating "Llama-3.1" series models.
* **Legend Entries:**
1. `Llama-3.1-70B: 4-shot CoT` (Yellow, dashed line with circle markers)
2. `Llama-3.1-70B: RAP-MCTS` (Orange, dashed line with circle markers)
3. `Llama-3.1-70B: SC-MCTS* (Ours)` (Red, solid line with circle markers)
4. `o1-mini: 4-shot` (Magenta, dashed line with circle markers)
5. `Llama-3.1-405B: 4-shot CoT` (Cyan, dashed line with circle markers)
**Right Chart Specifics:**
* **Title/Context:** Implied to be evaluating "Llama-3" series models.
* **Legend Entries:**
1. `Llama-3-70B: 4-shot CoT` (Yellow, dashed line with circle markers)
2. `Llama-3-70B: RAP-MCTS` (Orange, dashed line with circle markers)
3. `Llama-3-70B: SC-MCTS* (Ours)` (Red, solid line with circle markers)
4. `o1-mini: 4-shot` (Magenta, dashed line with circle markers)
5. `Llama-3.1-405B: 4-shot CoT` (Cyan, dashed line with circle markers) *[Note: This is the same model as in the left chart, used as a common baseline.]*
### Detailed Analysis
**Left Chart (Llama-3.1 Models):**
* **Trend Verification & Data Points (Approximate):**
* **Llama-3.1-70B: 4-shot CoT (Yellow):** Starts low (~0.62 at Step 2), drops sharply to ~0.29 at Step 4, recovers slightly to ~0.34 at Step 6, then declines steadily to ~0.17 at Step 8, ~0.19 at Step 10, and ~0.21 at Step 12. Overall trend is a steep initial drop followed by a low, fluctuating plateau.
* **Llama-3.1-70B: RAP-MCTS (Orange):** Starts very high (~0.98 at Step 2), declines gradually to ~0.91 at Step 4 and ~0.79 at Step 6, then drops more sharply to ~0.47 at Step 8, ~0.17 at Step 10, and ~0.11 at Step 12. Shows a consistent downward trend.
* **Llama-3.1-70B: SC-MCTS* (Ours) (Red):** Starts highest (~0.99 at Step 2), remains high at ~0.95 at Step 4 and ~0.81 at Step 6, then plummets to ~0.47 at Step 8, ~0.17 at Step 10, and recovers slightly to ~0.22 at Step 12. Follows a similar but slightly superior trajectory to RAP-MCTS until Step 6, after which it drops sharply.
* **o1-mini: 4-shot (Magenta):** Starts high (~0.96 at Step 2), drops to ~0.84 at Step 4, then falls sharply to ~0.53 at Step 6, ~0.39 at Step 8, ~0.29 at Step 10, and ~0.17 at Step 12. Shows a steady, significant decline.
* **Llama-3.1-405B: 4-shot CoT (Cyan):** Starts high (~0.89 at Step 2), drops to ~0.67 at Step 4, remains stable at ~0.66 at Step 6, dips to ~0.42 at Step 8, then recovers to ~0.59 at Step 10 and ~0.52 at Step 12. Exhibits a unique "dip and recover" pattern, ending as the highest-performing model at Step 12.
**Right Chart (Llama-3 Models):**
* **Trend Verification & Data Points (Approximate):**
* **Llama-3-70B: 4-shot CoT (Yellow):** Starts at ~0.55 at Step 2, declines to ~0.44 at Step 4, ~0.39 at Step 6, ~0.25 at Step 8, ~0.17 at Step 10, and ~0.12 at Step 12. Shows a steady, monotonic decline.
* **Llama-3-70B: RAP-MCTS (Orange):** Starts highest (~1.0 at Step 2), declines to ~0.89 at Step 4, ~0.75 at Step 6, ~0.45 at Step 8, ~0.22 at Step 10, and ~0.12 at Step 12. A strong, steady downward trend.
* **Llama-3-70B: SC-MCTS* (Ours) (Red):** Starts very high (~0.98 at Step 2), follows closely with RAP-MCTS to ~0.89 at Step 4 and ~0.76 at Step 6, then declines to ~0.53 at Step 8, ~0.22 at Step 10, and ~0.14 at Step 12. Performs slightly better than RAP-MCTS from Step 8 onward.
* **o1-mini: 4-shot (Magenta):** Starts high (~0.96 at Step 2), drops to ~0.84 at Step 4, then falls to ~0.52 at Step 6, ~0.39 at Step 8, ~0.29 at Step 10, and ~0.17 at Step 12. Trajectory is very similar to its performance in the left chart.
* **Llama-3.1-405B: 4-shot CoT (Cyan):** (Common baseline) Starts at ~0.88 at Step 2, drops to ~0.67 at Step 4, ~0.65 at Step 6, ~0.42 at Step 8, recovers to ~0.58 at Step 10, and ~0.52 at Step 12. Mirrors its performance in the left chart exactly.
### Key Observations
1. **Universal Performance Degradation:** All models and methods show a clear trend of decreasing accuracy as the number of reasoning steps increases. No model maintains high accuracy beyond 6-8 steps.
2. **Method Superiority at Low Steps:** The "SC-MCTS* (Ours)" and "RAP-MCTS" methods consistently achieve the highest accuracy (near 1.0) for the first 4-6 steps in both charts, significantly outperforming the standard 4-shot Chain-of-Thought (CoT) prompting.
3. **Catastrophic Drop-off:** The advanced MCTS-based methods (SC-MCTS*, RAP-MCTS) experience a particularly steep performance collapse between Step 6 and Step 8, falling from ~0.8 to below 0.5.
4. **Model Size vs. Method:** The largest model, `Llama-3.1-405B: 4-shot CoT` (cyan), demonstrates more resilience at higher step counts (Steps 10-12) compared to the 70B models using advanced methods, despite starting with lower initial accuracy. It is the only series that shows a recovery trend after Step 8.
5. **Consistency of o1-mini:** The `o1-mini: 4-shot` model (magenta) shows nearly identical performance profiles across both charts, suggesting its behavior is stable relative to the Llama model generations being tested.
6. **Llama-3.1 vs. Llama-3:** The `Llama-3.1-70B: 4-shot CoT` (yellow, left chart) starts with higher accuracy (~0.62) than its `Llama-3-70B` counterpart (~0.55, right chart) but both converge to similarly low performance by Step 12.
### Interpretation
The data suggests a fundamental challenge in multi-step reasoning for current LLMs: **accuracy decays rapidly with problem complexity (step count)**. While advanced search-guided methods like SC-MCTS and RAP-MCTS provide a massive boost for shorter reasoning chains (4-6 steps), they do not solve the scalability issue and may even become brittle, leading to a sharp performance cliff.
The standout performance of the much larger `Llama-3.1-405B` model using simple 4-shot CoT at higher step counts implies that **raw model scale may provide more robustness for long-horizon tasks than sophisticated but potentially fragile search algorithms applied to smaller models**. The "dip and recover" pattern for this model is anomalous and could indicate a specific difficulty at Step 8 for the test dataset, or a characteristic of the model's reasoning process.
From a research perspective, the charts argue that the frontier for complex reasoning lies not just in improving search efficiency (the MCTS methods), but in developing architectures or training paradigms that prevent the exponential error accumulation demonstrated here. The authors' method ("Ours") is effective within a limited range but does not overcome the core scalability barrier.
DECODING INTELLIGENCE...