## Diagram: Renormalization Group (RG) Transformation
### Overview
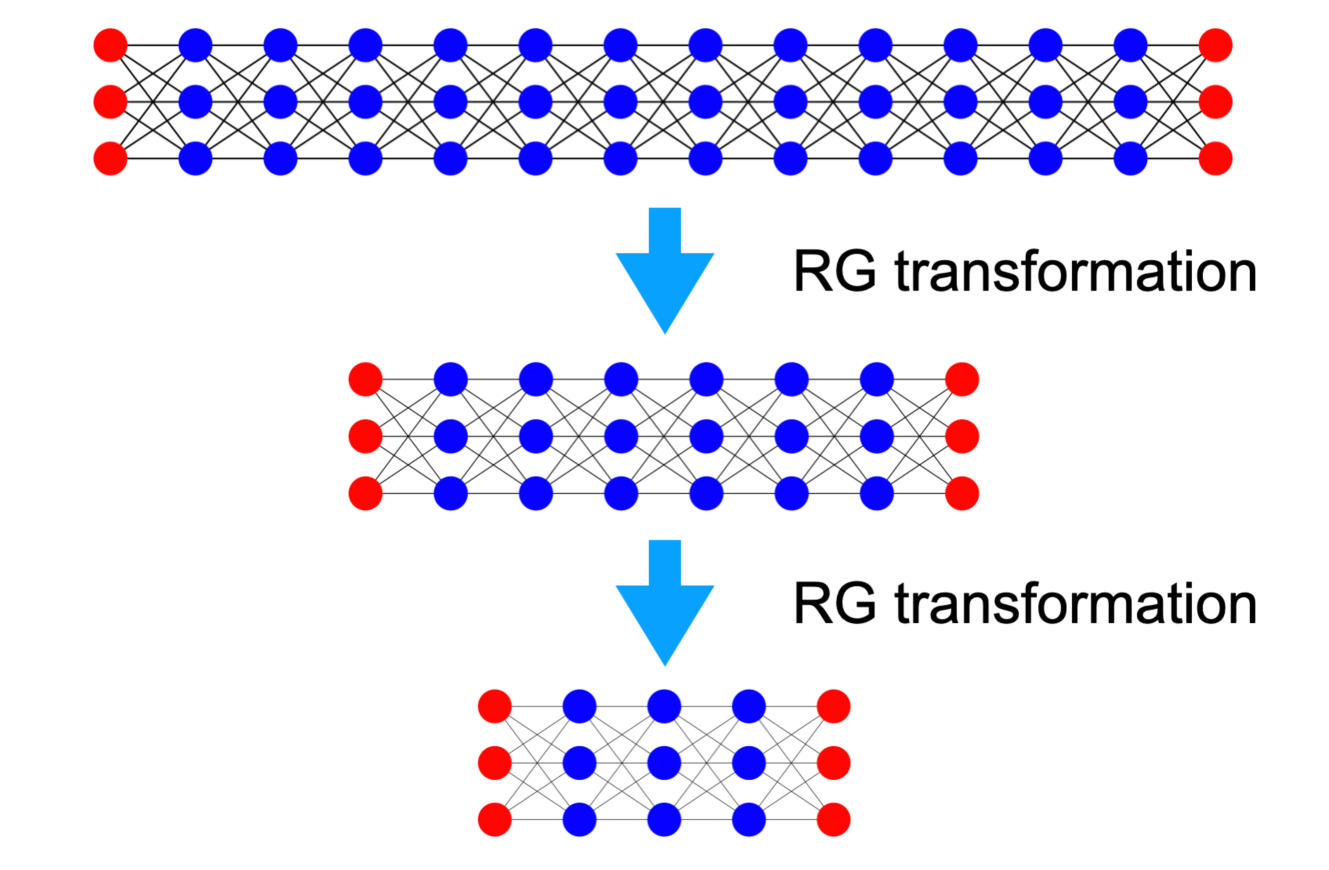
The image illustrates the concept of Renormalization Group (RG) transformation through a series of network diagrams. Each diagram represents a state of the system, and the transformation reduces the complexity of the network while preserving its essential properties. The diagram shows a network of nodes (represented by circles) connected by lines, undergoing two successive RG transformations.
### Components/Axes
* **Nodes:** Represented by blue and red circles.
* **Connections:** Represented by black lines connecting the nodes.
* **RG Transformation Arrows:** Blue arrows pointing downwards, indicating the direction of the transformation.
* **RG Transformation Labels:** Text labels "RG transformation" next to each arrow.
### Detailed Analysis
The diagram consists of three network diagrams stacked vertically, with arrows and labels indicating the RG transformation between them.
1. **Top Network:**
* Consists of 3 rows of nodes.
* The top and bottom rows have 3 red nodes each, positioned at the left and right ends.
* The middle row has 12 blue nodes.
* Each node is connected to its nearest neighbors in adjacent rows.
* The blue nodes are also connected to each other.
2. **Middle Network:**
* Consists of 3 rows of nodes.
* The top and bottom rows have 3 red nodes each, positioned at the left and right ends.
* The middle row has 6 blue nodes.
* Each node is connected to its nearest neighbors in adjacent rows.
* The blue nodes are also connected to each other.
3. **Bottom Network:**
* Consists of 3 rows of nodes.
* The top and bottom rows have 3 red nodes each, positioned at the left and right ends.
* The middle row has 3 blue nodes.
* Each node is connected to its nearest neighbors in adjacent rows.
* The blue nodes are also connected to each other.
The "RG transformation" label is placed to the right of each downward-pointing blue arrow.
### Key Observations
* The number of blue nodes decreases with each RG transformation (12 -> 6 -> 3).
* The number of red nodes remains constant (3 on each end).
* The connectivity between nodes is maintained throughout the transformations.
* The overall structure of the network is preserved, but the scale is reduced.
### Interpretation
The diagram illustrates the concept of the Renormalization Group (RG) transformation, which is a mathematical technique used to study systems with many interacting components at different scales. The RG transformation reduces the complexity of the system by integrating out the short-wavelength degrees of freedom, while preserving the long-wavelength behavior. In this diagram, the blue nodes represent the degrees of freedom that are being integrated out, while the red nodes represent the degrees of freedom that are being kept. The connections between the nodes represent the interactions between the degrees of freedom. The RG transformation reduces the number of blue nodes, while preserving the overall structure of the network. This demonstrates how the RG transformation can be used to simplify complex systems and extract their essential properties.