\n
## Diagram: RG Transformation Series
### Overview
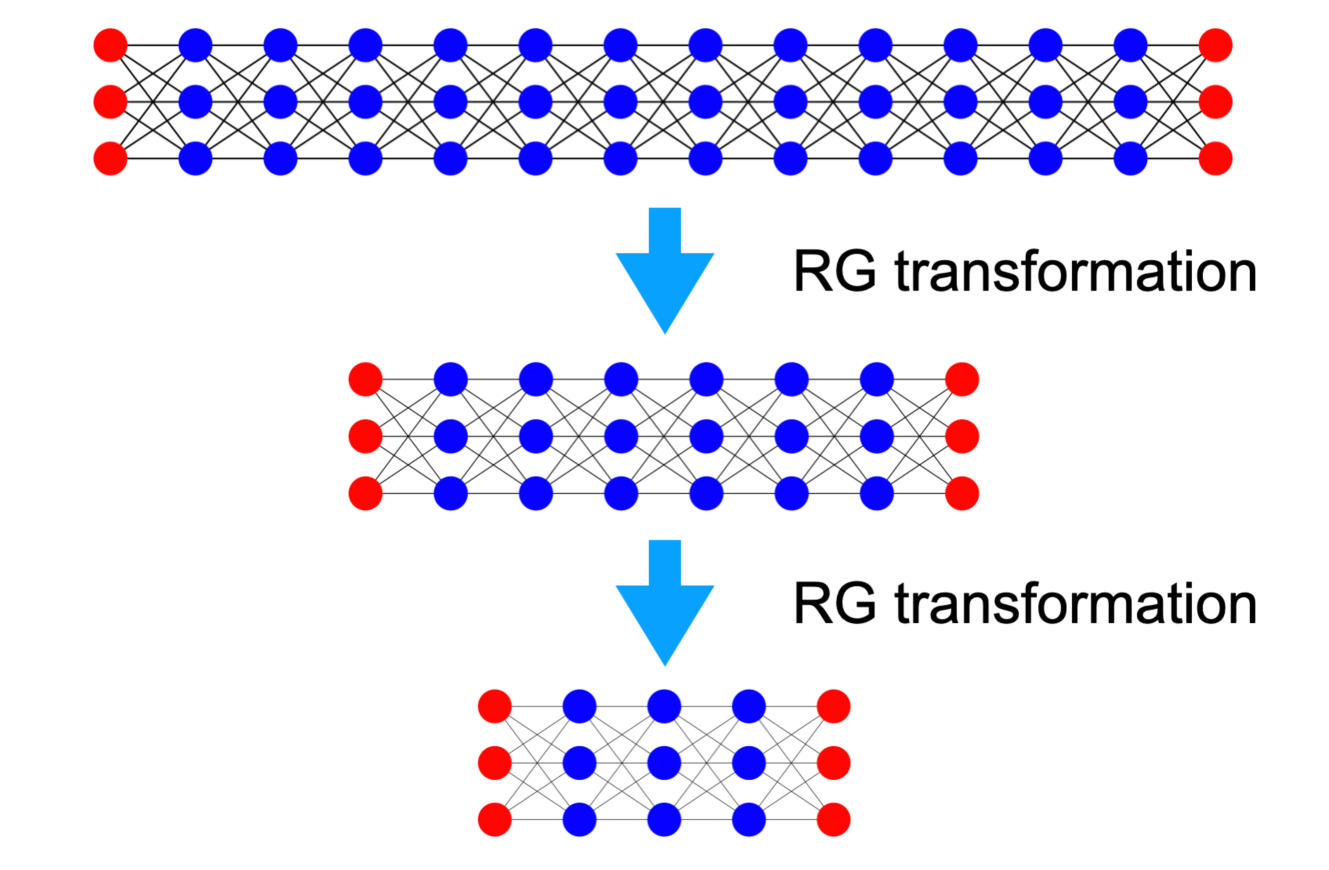
The image depicts a series of three diagrams illustrating a process labeled "RG transformation" applied to a network of nodes. The initial diagram shows a relatively large, elongated network. Subsequent diagrams show the network becoming progressively smaller and more condensed through the application of the RG transformation. The nodes are colored red and blue.
### Components/Axes
The diagram consists of three network representations connected by downward-pointing blue arrows. Each arrow is labeled "RG transformation". The networks are composed of nodes (circles) connected by lines. The nodes are colored either red or blue. There are no explicit axes or scales.
### Detailed Analysis or Content Details
**Diagram 1 (Top):**
* The network consists of approximately 30 nodes arranged in a roughly rectangular grid.
* The nodes alternate in color: red, blue, red, blue, and so on, across each row.
* There are approximately 6 rows of nodes.
* Nodes are connected to their immediate neighbors horizontally and vertically.
**Diagram 2 (Middle):**
* The network has been reduced in size to approximately 16 nodes.
* The arrangement is still grid-like, but more compact.
* The color pattern of red and blue nodes is maintained.
* Nodes are connected to their immediate neighbors horizontally and vertically.
**Diagram 3 (Bottom):**
* The network is further reduced to approximately 8 nodes.
* The arrangement is grid-like.
* The color pattern of red and blue nodes is maintained.
* Nodes are connected to their immediate neighbors horizontally and vertically.
### Key Observations
* The "RG transformation" appears to reduce the number of nodes in the network while preserving the alternating red/blue pattern and the connectivity structure.
* The transformation is applied sequentially, with each step resulting in a smaller, more condensed network.
* The diagram does not provide any quantitative information about the transformation process (e.g., how many nodes are removed at each step, or the criteria for selecting which nodes to remove).
### Interpretation
The diagram illustrates a Renormalization Group (RG) transformation applied to a network. RG transformations are commonly used in physics and other fields to simplify complex systems by iteratively eliminating degrees of freedom (in this case, nodes) while preserving the essential features of the system. The alternating red/blue color pattern likely represents some property of the nodes (e.g., spin up/down in a magnetic system, or different types of particles). The preservation of this pattern during the transformation suggests that the RG transformation is designed to maintain this property. The diagram suggests a process of coarse-graining or scale reduction, where the system is viewed at increasingly larger scales. The lack of quantitative information makes it difficult to determine the specific details of the transformation, but the diagram provides a clear visual representation of the overall process.