## Diagram: RG Transformation Process
### Overview
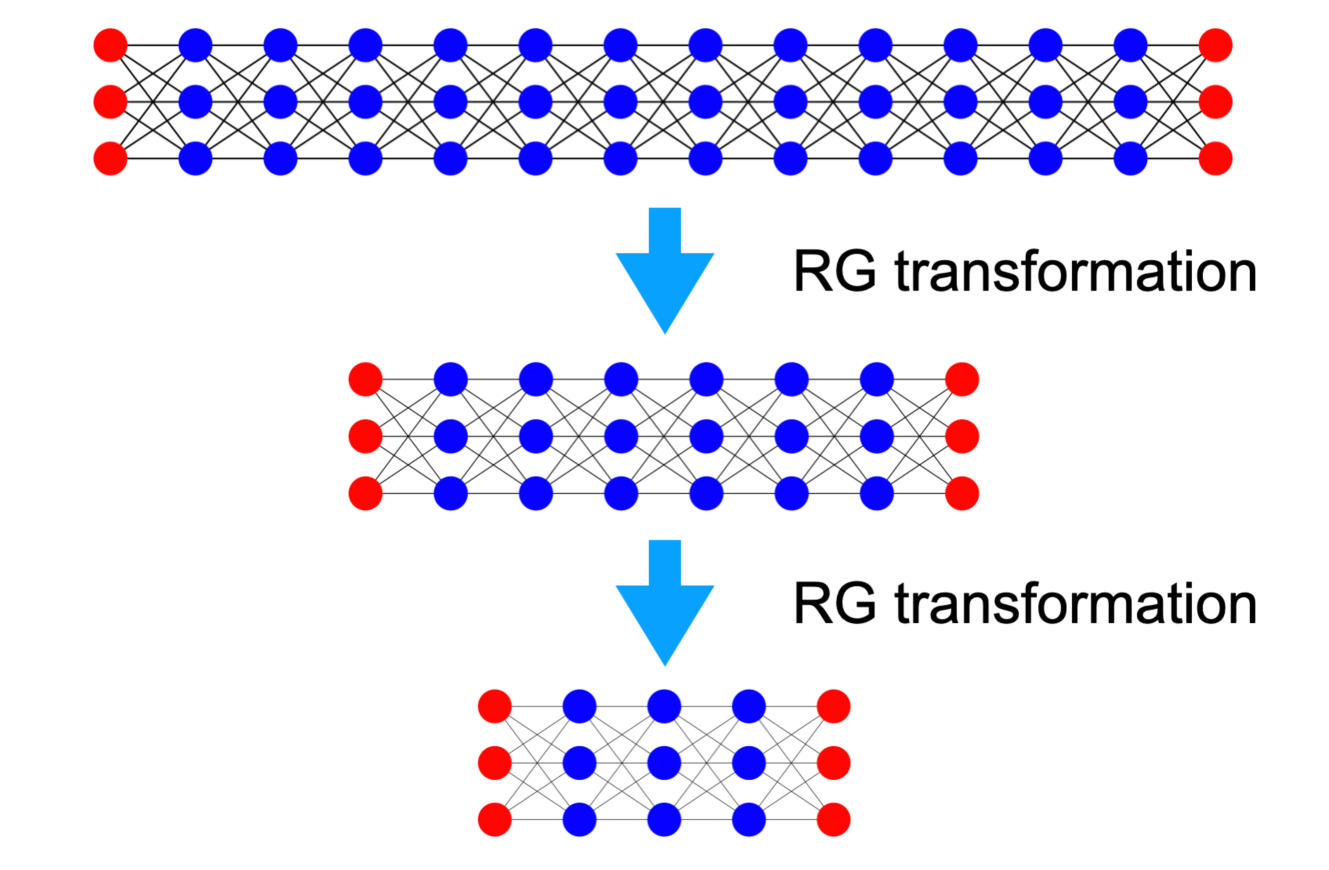
The diagram illustrates a hierarchical RG (Renormalization Group) transformation process across three sequential layers. Each layer consists of interconnected nodes (red and blue), with blue arrows indicating RG transformations between layers. The structure suggests a progressive simplification or coarse-graining of a system.
### Components/Axes
- **Nodes**:
- Red nodes (●) positioned at the ends of each layer.
- Blue nodes (●) distributed between red nodes in the middle of each layer.
- **Connections**:
- Black lines interconnect nodes within and across layers, forming a grid-like network.
- **Arrows**:
- Two blue arrows labeled "RG transformation" point downward between layers, indicating sequential transformations.
- **Color Coding**:
- Red nodes likely represent boundary or fixed elements; blue nodes represent internal/intermediate elements.
### Detailed Analysis
1. **Layer Structure**:
- **Top Layer**:
- 5 red nodes (●) at both ends.
- 10 blue nodes (●) between red nodes.
- Dense black connections form a fully interconnected grid.
- **Middle Layer**:
- 4 red nodes (●) at both ends.
- 8 blue nodes (●) between red nodes.
- Reduced density of connections compared to the top layer.
- **Bottom Layer**:
- 3 red nodes (●) at both ends.
- 6 blue nodes (●) between red nodes.
- Minimal connections, forming a sparse grid.
2. **RG Transformations**:
- Arrows labeled "RG transformation" connect layers vertically, suggesting a stepwise reduction in system complexity.
- Each transformation reduces the number of red and blue nodes by 1 per layer (e.g., 5→4→3 red nodes).
3. **Spatial Grounding**:
- All elements are horizontally aligned, with layers stacked vertically.
- Arrows are centrally positioned between layers, emphasizing the transformation sequence.
### Key Observations
- **Node Reduction**: Each RG transformation reduces the total number of nodes (red + blue) by 2 per layer.
- **Connection Density**: The network becomes sparser with each transformation, indicating a loss of fine-grained detail.
- **Color Consistency**: Red nodes remain at the boundaries across all layers, while blue nodes decrease in count.
### Interpretation
This diagram likely represents a physical or computational process where RG transformations iteratively simplify a system. In physics, RG transformations often involve "coarse-graining" a system by averaging over short-range interactions, effectively reducing degrees of freedom. The red nodes may represent fixed boundary conditions or conserved quantities, while blue nodes could symbolize dynamic or variable elements. The progressive simplification suggests the system is being analyzed at different energy scales or resolution levels, a common approach in statistical mechanics or quantum field theory. The absence of numerical data implies the focus is on the structural relationship between layers rather than quantitative metrics.